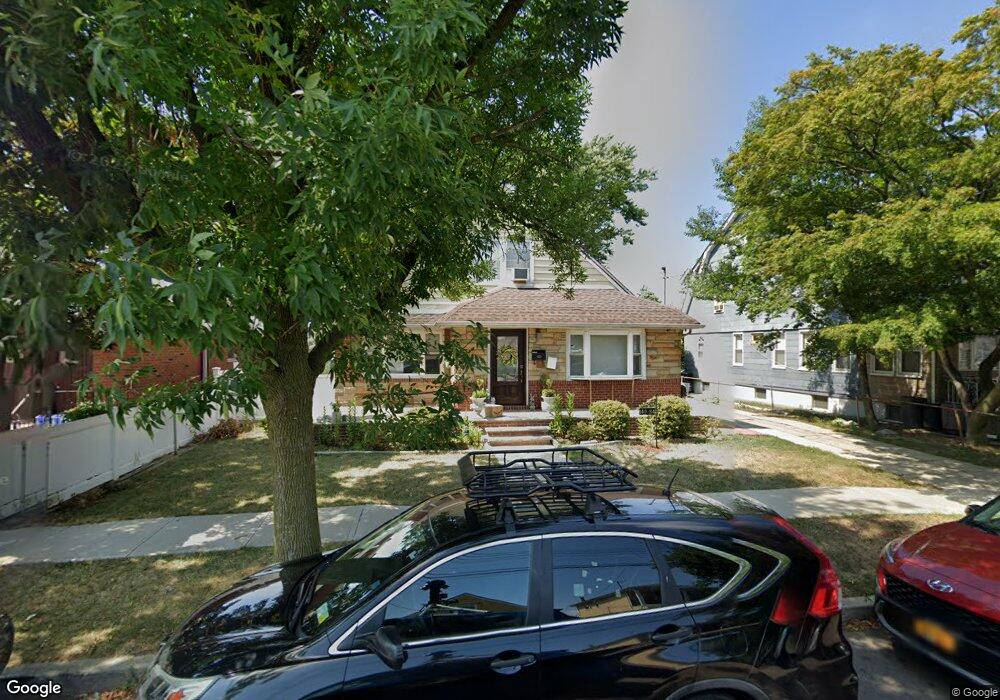
14934 114th Place South Ozone Park, NY 11420
South Ozone Park NeighborhoodEstimated Value: $985,760 - $1,266,000
--
Bed
--
Bath
1,949
Sq Ft
$600/Sq Ft
Est. Value
About This Home
This home is located at 14934 114th Place, South Ozone Park, NY 11420 and is currently estimated at $1,169,690, approximately $600 per square foot. 14934 114th Place is a home located in Queens County with nearby schools including Ps 124 Osmond A Church, J.H.S. 226 Virgil I. Grisson, and John Adams High School.
Ownership History
Date
Name
Owned For
Owner Type
Purchase Details
Closed on
Mar 10, 2017
Sold by
Ramirez Lizbet C and Ramirez Robertson A
Bought by
Ramirez Robertson A
Current Estimated Value
Home Financials for this Owner
Home Financials are based on the most recent Mortgage that was taken out on this home.
Original Mortgage
$137,912
Outstanding Balance
$114,300
Interest Rate
4.15%
Mortgage Type
New Conventional
Estimated Equity
$1,055,390
Purchase Details
Closed on
Jul 26, 2000
Sold by
Lagrassa Frank and Lagrassa Jack
Bought by
Ramirez Robertson A and Ramirez Lizbet C
Home Financials for this Owner
Home Financials are based on the most recent Mortgage that was taken out on this home.
Original Mortgage
$292,500
Interest Rate
8.13%
Purchase Details
Closed on
Jul 31, 1994
Sold by
Lagrassa Rose
Bought by
Lagrassa Rose and Lagrassa Jack
Create a Home Valuation Report for This Property
The Home Valuation Report is an in-depth analysis detailing your home's value as well as a comparison with similar homes in the area
Home Values in the Area
Average Home Value in this Area
Purchase History
| Date | Buyer | Sale Price | Title Company |
|---|---|---|---|
| Ramirez Robertson A | $87,500 | -- | |
| Ramirez Robertson A | $87,500 | -- | |
| Ramirez Robertson A | $325,000 | -- | |
| Lagrassa Frank | -- | -- | |
| Ramirez Robertson A | $325,000 | -- | |
| Lagrassa Rose | -- | Commonwealth Land Title Ins | |
| Lagrassa Rose | -- | Commonwealth Land Title Ins |
Source: Public Records
Mortgage History
| Date | Status | Borrower | Loan Amount |
|---|---|---|---|
| Open | Ramirez Robertson A | $137,912 | |
| Closed | Ramirez Robertson A | $137,912 | |
| Previous Owner | Ramirez Robertson A | $292,500 |
Source: Public Records
Tax History Compared to Growth
Tax History
| Year | Tax Paid | Tax Assessment Tax Assessment Total Assessment is a certain percentage of the fair market value that is determined by local assessors to be the total taxable value of land and additions on the property. | Land | Improvement |
|---|---|---|---|---|
| 2025 | $8,125 | $41,904 | $8,693 | $33,211 |
| 2024 | $8,137 | $41,854 | $10,408 | $31,446 |
| 2023 | $7,649 | $39,485 | $9,655 | $29,830 |
| 2022 | $7,545 | $57,900 | $14,040 | $43,860 |
| 2021 | $7,494 | $51,300 | $14,040 | $37,260 |
| 2020 | $7,096 | $56,100 | $14,040 | $42,060 |
| 2019 | $7,003 | $54,660 | $14,040 | $40,620 |
| 2018 | $6,410 | $32,904 | $9,846 | $23,058 |
| 2017 | $6,365 | $32,696 | $11,120 | $21,576 |
| 2016 | $5,857 | $32,696 | $11,120 | $21,576 |
| 2015 | $3,704 | $29,100 | $11,700 | $17,400 |
| 2014 | $3,704 | $29,065 | $11,686 | $17,379 |
Source: Public Records
Map
Nearby Homes
- 149-27 114th St
- 11512 135th Ave
- 11514 135th Ave
- 150-24 117th St
- 13336 114th Place
- 117-10 135th Ave
- 149-34 Lefferts Blvd
- 133-24 118th St
- 130-55 116th St
- 12104 150th Ave
- 12114 149th Ave
- 13220 114th St
- 150-33 Hawtree St
- 150-29 Hawtree St
- 150-25 Hawtree St
- 150-21 Hawtree St
- 150-17 Hawtree St
- 150-15 Hawtree St
- 135-28 122nd St
- 114-02 Sutter Ave
- 14940 114th Place
- 14930 114th Place
- 149-28 114th Place Unit 2nd fl
- 149-28 114th Place
- 14928 114th Place
- 14942 114th Place
- 14931 114th St
- 14937 114th St
- 149-27 114 St
- 149-27 114th St Unit 2
- 14927 114th St
- 14937 114th St Unit 2
- 14941 114th St
- 14922 114th Place
- 14923 114th St
- 149-45 114th St
- 14950 114th Place
- 14945 114th St
- 14935 114th Place
- 14929 114th Place