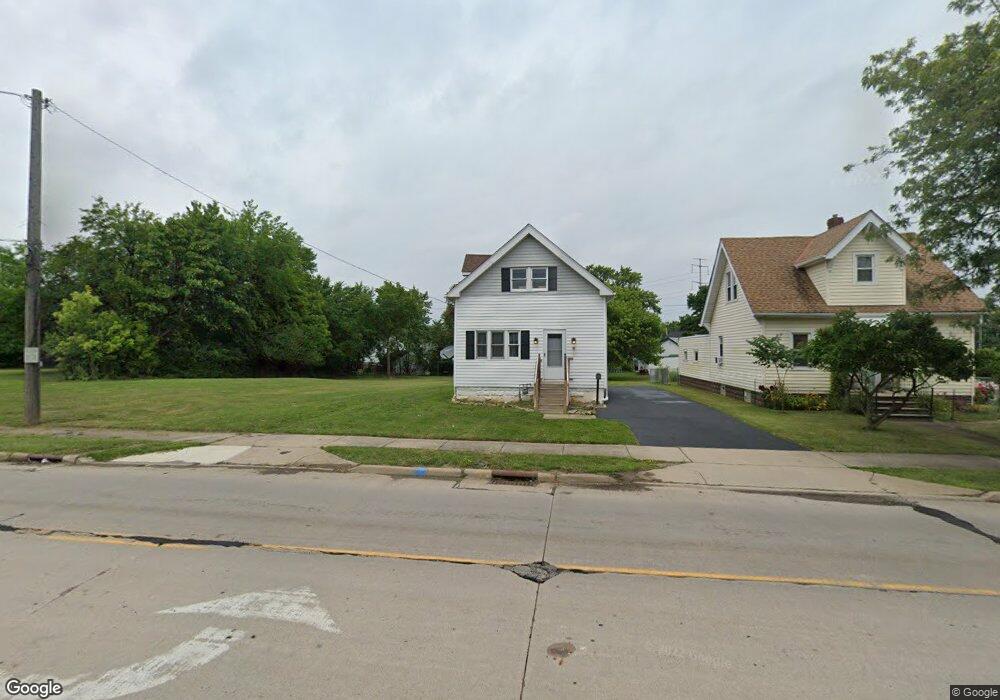
14937 Granger Rd Maple Heights, OH 44137
Estimated Value: $85,901 - $112,000
2
Beds
1
Bath
758
Sq Ft
$128/Sq Ft
Est. Value
About This Home
This home is located at 14937 Granger Rd, Maple Heights, OH 44137 and is currently estimated at $96,975, approximately $127 per square foot. 14937 Granger Rd is a home located in Cuyahoga County with nearby schools including Abraham Lincoln Elementary School, Rockside/ J.F. Kennedy School, and Barack Obama School.
Ownership History
Date
Name
Owned For
Owner Type
Purchase Details
Closed on
Jan 10, 2025
Sold by
Sanders Robert A
Bought by
Raslj Llc
Current Estimated Value
Purchase Details
Closed on
Feb 28, 2021
Sold by
Twitt Gina M
Bought by
Sanders Robert A
Purchase Details
Closed on
Mar 7, 2013
Sold by
Gliha Michael L
Bought by
Twitt Gina M
Purchase Details
Closed on
Mar 17, 1987
Sold by
Kus Raymond C
Bought by
Gliha Michael L
Purchase Details
Closed on
May 30, 1986
Sold by
Kus Raymond C and Kus Ramona
Bought by
Kus Raymond C
Purchase Details
Closed on
Mar 13, 1985
Sold by
Kus Raymond C
Bought by
Kus Raymond C and Kus Ramona
Purchase Details
Closed on
Aug 29, 1978
Sold by
Gliha Michael L
Bought by
Kus Raymond C
Purchase Details
Closed on
May 16, 1977
Sold by
Fields Robert J
Bought by
Gliha Michael L
Purchase Details
Closed on
Mar 18, 1976
Sold by
Cline Gladys M
Bought by
Fields Robert J
Purchase Details
Closed on
Jan 1, 1975
Bought by
Cline Gladys M
Create a Home Valuation Report for This Property
The Home Valuation Report is an in-depth analysis detailing your home's value as well as a comparison with similar homes in the area
Home Values in the Area
Average Home Value in this Area
Purchase History
| Date | Buyer | Sale Price | Title Company |
|---|---|---|---|
| Raslj Llc | -- | Elevated Title | |
| Raslj Llc | -- | Elevated Title | |
| Sanders Robert A | $5,000 | None Available | |
| Twitt Gina M | $15,000 | None Available | |
| Gliha Michael L | $11,900 | -- | |
| Kus Raymond C | -- | -- | |
| Kus Raymond C | -- | -- | |
| Kus Raymond C | $19,700 | -- | |
| Gliha Michael L | $23,700 | -- | |
| Fields Robert J | $20,000 | -- | |
| Cline Gladys M | -- | -- |
Source: Public Records
Tax History
| Year | Tax Paid | Tax Assessment Tax Assessment Total Assessment is a certain percentage of the fair market value that is determined by local assessors to be the total taxable value of land and additions on the property. | Land | Improvement |
|---|---|---|---|---|
| 2024 | $2,442 | $25,270 | $6,615 | $18,655 |
| 2023 | $1,824 | $15,750 | $3,920 | $11,830 |
| 2022 | $1,818 | $15,750 | $3,920 | $11,830 |
| 2021 | $1,893 | $15,750 | $3,920 | $11,830 |
| 2020 | $1,634 | $11,940 | $2,980 | $8,960 |
| 2019 | $1,623 | $34,100 | $8,500 | $25,600 |
| 2018 | $1,873 | $11,940 | $2,980 | $8,960 |
| 2017 | $1,656 | $12,080 | $3,780 | $8,300 |
| 2016 | $1,602 | $12,080 | $3,780 | $8,300 |
| 2015 | $3,762 | $12,080 | $3,780 | $8,300 |
| 2014 | $3,762 | $12,470 | $3,890 | $8,580 |
Source: Public Records
Map
Nearby Homes
- 15095 Granger Rd
- 14567 Pease Rd
- 14512 Granger Rd
- 14510 Granger Rd
- 14305 Granger Rd
- 5220 Forest Ave
- 5179 Milo Ave
- 14818 Reddington Ave
- 13719 Wolf Ave
- 13704 Linn Ave
- 5408 Roland Dr
- 15404 Fernway Dr
- 16174 Friendly St
- 14619 Tokay Ave
- 13917 Maple Leaf Dr
- 14404 Tokay Ave
- 13417 Granger Rd
- 5270 E 135th St
- 14203 Tabor Ave
- 13905 Thraves Ave
- 14901 Granger Rd
- 14901 Granger Rd Unit 282
- 14969 Granger Rd
- 14875 Granger Rd
- 5380 Royal St
- 15001 Granger Rd
- 14809 Granger Rd
- 15025 Granger Rd
- 5349 Meadow St
- 5347 Meadow St
- 5378 Royal St
- 5343 Meadow St
- 5341 Meadow St
- 14807 Granger Rd
- 5374 Royal St
- 5335 Meadow St
- 5373 Royal St
- 14801 Granger Rd
- 5333 Meadow St
- 5370 Royal St