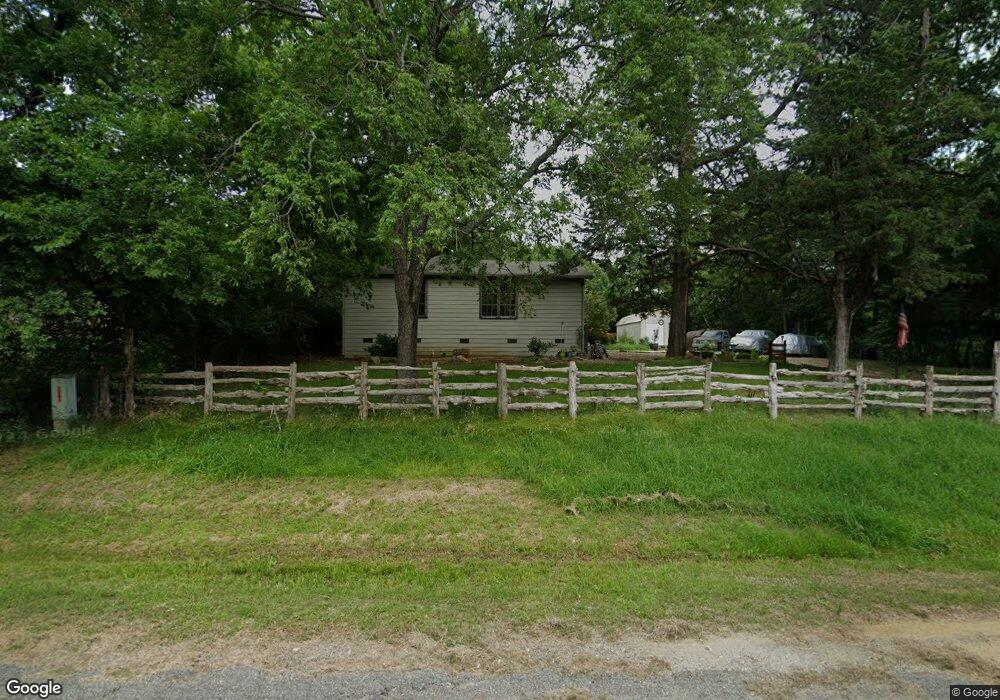
1494 Desvoignes Rd Denison, TX 75021
Estimated Value: $182,452 - $315,000
3
Beds
2
Baths
1,028
Sq Ft
$242/Sq Ft
Est. Value
About This Home
This home is located at 1494 Desvoignes Rd, Denison, TX 75021 and is currently estimated at $248,726, approximately $241 per square foot. 1494 Desvoignes Rd is a home located in Grayson County with nearby schools including Lamar Elementary School, Scott Middle School, and Denison High School.
Ownership History
Date
Name
Owned For
Owner Type
Purchase Details
Closed on
Nov 3, 2016
Sold by
Mandujano Jose Manuel and Mandujano Venita Raquel
Bought by
Lavaux Herbert Alan
Current Estimated Value
Home Financials for this Owner
Home Financials are based on the most recent Mortgage that was taken out on this home.
Original Mortgage
$110,000
Outstanding Balance
$88,478
Interest Rate
3.48%
Mortgage Type
VA
Estimated Equity
$160,248
Purchase Details
Closed on
Jan 7, 2014
Sold by
Morris Rickey Ray
Bought by
Neal Holly S
Purchase Details
Closed on
Jan 19, 2012
Sold by
Beard Christine D
Bought by
Morris Rickey Ray
Home Financials for this Owner
Home Financials are based on the most recent Mortgage that was taken out on this home.
Original Mortgage
$22,018
Interest Rate
4.03%
Mortgage Type
Purchase Money Mortgage
Create a Home Valuation Report for This Property
The Home Valuation Report is an in-depth analysis detailing your home's value as well as a comparison with similar homes in the area
Home Values in the Area
Average Home Value in this Area
Purchase History
| Date | Buyer | Sale Price | Title Company |
|---|---|---|---|
| Lavaux Herbert Alan | -- | Grayson County Title | |
| Neal Holly S | $19,853 | None Available | |
| Morris Rickey Ray | -- | Grayson County Title |
Source: Public Records
Mortgage History
| Date | Status | Borrower | Loan Amount |
|---|---|---|---|
| Open | Lavaux Herbert Alan | $110,000 | |
| Previous Owner | Morris Rickey Ray | $22,018 |
Source: Public Records
Tax History
| Year | Tax Paid | Tax Assessment Tax Assessment Total Assessment is a certain percentage of the fair market value that is determined by local assessors to be the total taxable value of land and additions on the property. | Land | Improvement |
|---|---|---|---|---|
| 2025 | $451 | $195,370 | $32,492 | $162,878 |
| 2024 | $2,871 | $177,746 | $0 | $0 |
| 2023 | $451 | $161,587 | $0 | $0 |
| 2022 | $2,538 | $146,897 | $0 | $0 |
| 2021 | $2,504 | $133,543 | $12,900 | $120,643 |
| 2020 | $2,641 | $132,645 | $11,733 | $120,912 |
| 2019 | $2,635 | $124,054 | $11,733 | $112,321 |
| 2018 | $2,518 | $117,326 | $11,733 | $105,593 |
| 2017 | $2,335 | $108,087 | $9,514 | $98,573 |
| 2016 | $489 | $22,621 | $9,514 | $13,107 |
Source: Public Records
Map
Nearby Homes
- 246 Karen Dr
- 413 Rolling Acres Rd
- 1747 Desvoignes Rd
- 66 Shady Woods Ln
- 199 Chaparral Estates Dr
- 21 Chaparral Estates Dr
- TBD N Highway 69
- 40 Sheryl Ln
- 1382 US Highway 69
- 513 Joy Ln
- 516 Forrest Ln
- 124 Mark Dr
- 125 Mark Dr
- 227 Sheryl Ln
- TBD Cleve Cole Rd
- 41 Kelsey Rd
- 230 Frosty Hollow Rd
- 2526 S Fannin Ave Unit 2600
- TBD Johnson Rd
- 2931 S Barrett Ave
- 1155 Desvoignes Rd
- 1470 Desvoignes Rd
- 234 Karen Dr
- 225 Karen Dr
- 152 Karen Dr
- 169 Karen Dr
- 247 Karen Dr
- TBD 1 Karen
- 1350 Desvoignes Rd
- 1410 Desvoignes Rd
- 1651 Desvoignes Rd
- 99 Karen Dr
- 0 Arthur Rd Unit 10203927
- 142 Arthur Rd
- 408 Rolling Acres Rd
- 1695 Desvoignes Rd
- 374 Rolling Acres Rd
- 110 Arthur Rd
- 1266 Desvoignes Rd
- 50 Karen Dr
Your Personal Tour Guide
Ask me questions while you tour the home.