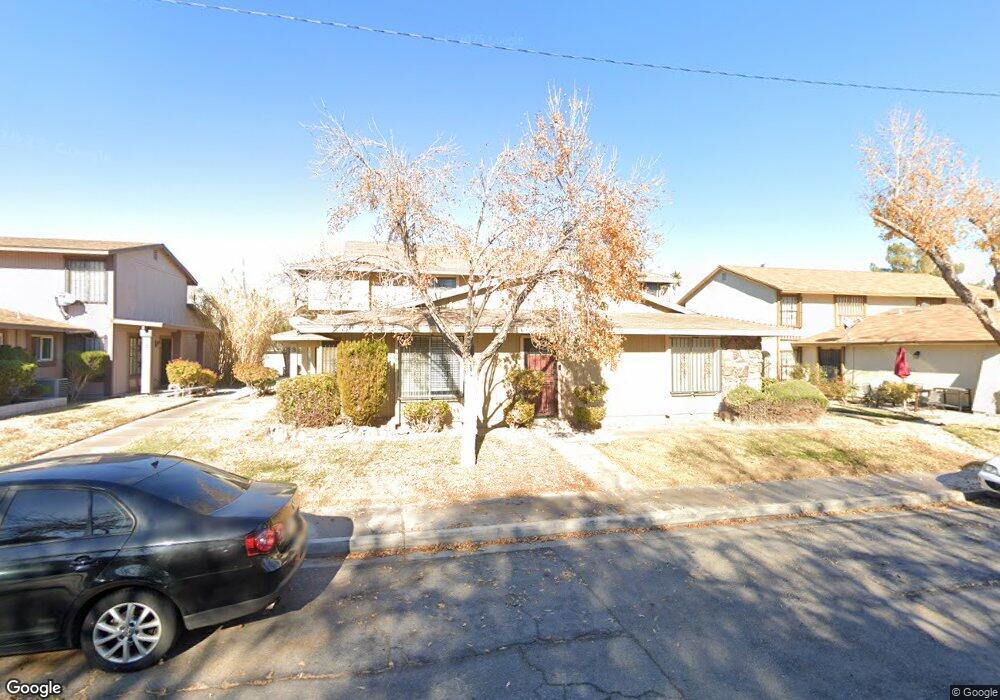
1494 Lorilyn Ave Unit 1 Las Vegas, NV 89119
University District NeighborhoodEstimated Value: $203,000 - $220,000
2
Beds
2
Baths
1,064
Sq Ft
$199/Sq Ft
Est. Value
About This Home
This home is located at 1494 Lorilyn Ave Unit 1, Las Vegas, NV 89119 and is currently estimated at $212,114, approximately $199 per square foot. 1494 Lorilyn Ave Unit 1 is a home located in Clark County with nearby schools including Lewis E Rowe Elementary School, William E. Orr Middle School, and Del Sol Academy of the Performing Arts.
Ownership History
Date
Name
Owned For
Owner Type
Purchase Details
Closed on
Mar 29, 2024
Sold by
Moms Family Trust and Mayers Sylvia M
Bought by
Morledge Erin and Morledge Frederick Leighton
Current Estimated Value
Home Financials for this Owner
Home Financials are based on the most recent Mortgage that was taken out on this home.
Original Mortgage
$190,000
Outstanding Balance
$187,172
Interest Rate
6.9%
Mortgage Type
New Conventional
Estimated Equity
$24,942
Purchase Details
Closed on
Jun 24, 2009
Sold by
Mayers Sylvia
Bought by
Moms Family Trust 2009
Purchase Details
Closed on
Oct 27, 2004
Sold by
Mastin Victor B and Mastin Irma C
Bought by
Mayers Sylvia
Purchase Details
Closed on
Mar 29, 2002
Sold by
Woods Floy Jennie
Bought by
Mastin Victor B and Mastin Irma C
Home Financials for this Owner
Home Financials are based on the most recent Mortgage that was taken out on this home.
Original Mortgage
$50,000
Interest Rate
6.84%
Mortgage Type
Seller Take Back
Create a Home Valuation Report for This Property
The Home Valuation Report is an in-depth analysis detailing your home's value as well as a comparison with similar homes in the area
Home Values in the Area
Average Home Value in this Area
Purchase History
| Date | Buyer | Sale Price | Title Company |
|---|---|---|---|
| Morledge Erin | $200,000 | Security 1St Title | |
| Moms Family Trust 2009 | -- | None Available | |
| Mayers Sylvia | $135,000 | Old Republic Title Co Of Nv | |
| Mastin Victor B | $62,000 | Land Title |
Source: Public Records
Mortgage History
| Date | Status | Borrower | Loan Amount |
|---|---|---|---|
| Open | Morledge Erin | $190,000 | |
| Previous Owner | Mastin Victor B | $50,000 |
Source: Public Records
Tax History Compared to Growth
Tax History
| Year | Tax Paid | Tax Assessment Tax Assessment Total Assessment is a certain percentage of the fair market value that is determined by local assessors to be the total taxable value of land and additions on the property. | Land | Improvement |
|---|---|---|---|---|
| 2025 | $675 | $24,849 | $15,050 | $9,799 |
| 2024 | $626 | $24,849 | $15,050 | $9,799 |
| 2023 | $626 | $31,835 | $22,750 | $9,085 |
| 2022 | $580 | $25,073 | $16,450 | $8,623 |
| 2021 | $537 | $24,401 | $15,750 | $8,651 |
| 2020 | $496 | $24,256 | $15,400 | $8,856 |
| 2019 | $464 | $20,983 | $11,900 | $9,083 |
| 2018 | $443 | $16,057 | $7,000 | $9,057 |
| 2017 | $463 | $15,797 | $6,300 | $9,497 |
| 2016 | $416 | $14,106 | $4,200 | $9,906 |
| 2015 | $414 | $14,105 | $4,200 | $9,905 |
| 2014 | $414 | $15,805 | $5,075 | $10,730 |
Source: Public Records
Map
Nearby Homes
- 1509 Lorilyn Ave Unit 2
- 1481 Lorilyn Ave Unit 1
- 1372 Lorilyn Ave Unit 3
- 1467 Hialeah Dr Unit D
- 1500 Hialeah Dr Unit A
- 1500 Hialeah Dr Unit C
- 1450 Hialeah Dr Unit D
- 1424 Santa Anita Dr Unit D
- 1511 Living Desert Dr Unit C
- 1375 Hialeah Dr Unit C
- 1325 Del Mar St Unit 202
- 1569 Hialeah Dr
- 1309 Dorothy Ave Unit 2
- 1307 Lorilyn Ave Unit 1
- 1341 Del Mar St Unit 101
- 1321 Del Mar St Unit 4
- 1370 Hialeah Dr Unit B
- 1675 Jupiter Ct Unit C
- 1729 Jupiter Ct Unit B
- 5015 Spencer St Unit C
- 1494 Lorilyn Ave Unit 3
- 1480 Lorilyn Ave Unit 1
- 1466 Lorilyn Ave Unit 1
- 1494 Lorilyn Ave Unit 2
- 1508 Lorilyn Ave Unit 1
- 1480 Lorilyn Ave Unit 2
- 1466 Lorilyn Ave Unit 3
- 1480 Lorilyn Ave Unit 3
- 1508 Lorilyn Ave Unit 3
- 1508 Lorilyn Ave Unit 2
- 1466 Lorilyn Ave Unit 2
- 1558 Elizabeth Ave Unit 2
- 1558 Elizabeth Ave Unit 3
- 1558 Elizabeth Ave Unit 4
- 1558 Elizabeth Ave Unit 1
- 1544 Elizabeth Ave Unit 4
- 1544 Elizabeth Ave Unit 3
- 1544 Elizabeth Ave Unit 1
- 1544 Elizabeth Ave Unit 2
- 1572 Elizabeth Ave Unit 4