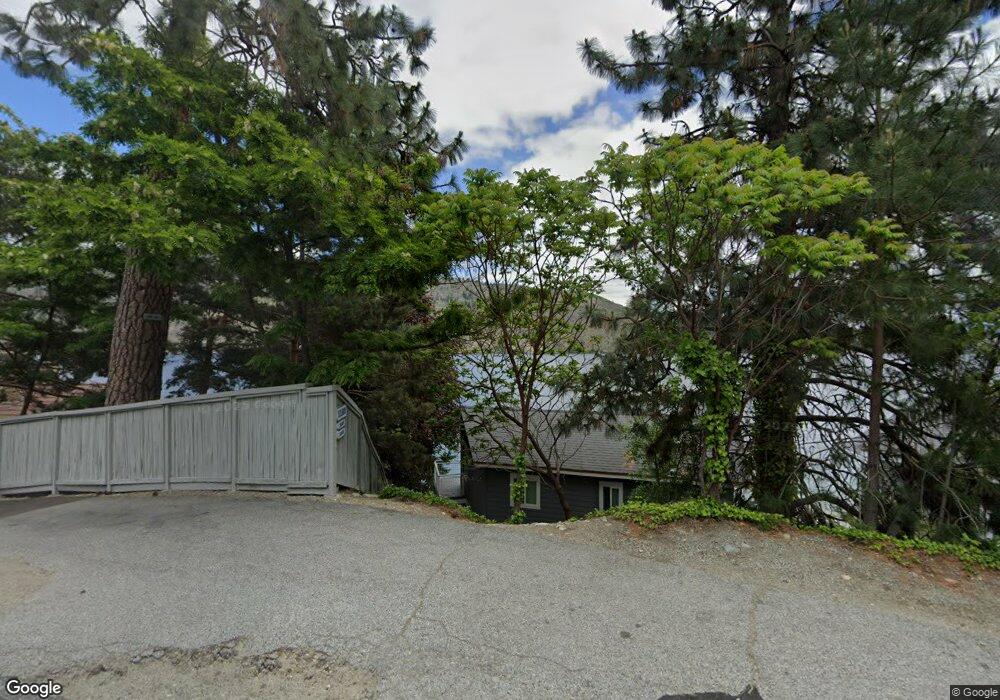
14942 S Lakeshore Rd Chelan, WA 98816
Estimated Value: $1,752,138 - $1,773,000
--
Bed
2
Baths
912
Sq Ft
$1,935/Sq Ft
Est. Value
About This Home
This home is located at 14942 S Lakeshore Rd, Chelan, WA 98816 and is currently estimated at $1,764,713, approximately $1,934 per square foot. 14942 S Lakeshore Rd is a home located in Chelan County with nearby schools including Morgen Owings Elementary School, Holden Village Community School, and Chelan Middle School.
Ownership History
Date
Name
Owned For
Owner Type
Purchase Details
Closed on
Dec 31, 2019
Sold by
Nelson William C and Nelson Lorraine B
Bought by
Nelson William C and Nelson Lorraine B
Current Estimated Value
Home Financials for this Owner
Home Financials are based on the most recent Mortgage that was taken out on this home.
Original Mortgage
$1,049,000
Outstanding Balance
$920,449
Interest Rate
3.25%
Mortgage Type
New Conventional
Estimated Equity
$844,264
Purchase Details
Closed on
Sep 21, 2007
Sold by
2911 Second Avenue Llc
Bought by
Nelson William C and Nelson Lorraine B
Home Financials for this Owner
Home Financials are based on the most recent Mortgage that was taken out on this home.
Original Mortgage
$868,000
Interest Rate
6.4%
Mortgage Type
Unknown
Purchase Details
Closed on
Jul 19, 2007
Sold by
Nelson Brian S and Morrow Mary M
Bought by
2911 Second Ave Llc
Create a Home Valuation Report for This Property
The Home Valuation Report is an in-depth analysis detailing your home's value as well as a comparison with similar homes in the area
Home Values in the Area
Average Home Value in this Area
Purchase History
| Date | Buyer | Sale Price | Title Company |
|---|---|---|---|
| Nelson William C | -- | Servicelink | |
| Nelson William C | $1,085,000 | Central Wash Title Service | |
| 2911 Second Ave Llc | -- | Central Washington Title Ser |
Source: Public Records
Mortgage History
| Date | Status | Borrower | Loan Amount |
|---|---|---|---|
| Open | Nelson William C | $1,049,000 | |
| Closed | Nelson William C | $868,000 |
Source: Public Records
Tax History Compared to Growth
Tax History
| Year | Tax Paid | Tax Assessment Tax Assessment Total Assessment is a certain percentage of the fair market value that is determined by local assessors to be the total taxable value of land and additions on the property. | Land | Improvement |
|---|---|---|---|---|
| 2021 | $9,163 | $1,078,072 | $760,000 | $318,072 |
| 2020 | $8,356 | $1,018,771 | $615,600 | $403,171 |
| 2019 | $6,453 | $917,800 | $554,800 | $363,000 |
| 2018 | $8,062 | $718,889 | $509,200 | $209,689 |
| 2017 | $6,447 | $816,096 | $494,000 | $322,096 |
| 2016 | $6,953 | $691,253 | $380,000 | $311,253 |
| 2015 | $6,953 | $731,202 | $364,800 | $366,402 |
| 2013 | $6,953 | $687,668 | $418,000 | $269,668 |
Source: Public Records
Map
Nearby Homes
- 15082 S Lakeshore Rd
- 15137 S Lakeshore Rd
- 14522 Morning Sun Dr
- 16495 S Lakeshore Rd
- 2570 Emerson Acres Rd
- 0 Sapphire Ln Unit NWM2258629
- 67 Apple Box Ln
- 1 ABC S Lakeshore Rd
- 1 C S Lakeshore Rd
- 1 B S Lakeshore Rd
- 1 A S Lakeshore Rd
- 555 Loop Ave
- 142 Lainey Ln
- 116 Lainey Ln
- 0 Lainey Ln Unit NWM2355054
- 157 Lainey Ln
- 0 Loop Ave
- 115 Lainey Ln
- 149 Lainey Ln
- 0 Lower Joe Creek Rd Unit NWM2441658
- 14948 S Lakeshore Rd
- 14894 S Lakeshore Rd
- 14976 S Lakeshore Rd
- 14892 S Lakeshore Rd
- 14941 S Lakeshore Rd
- 15020 S Lakeshore Rd
- 14876 S Lakeshore Rd
- 14965 S Lakeshore Rd
- 14858 Morning Sun Dr
- 15048 S Lakeshore Rd
- 14834 Morning Sun Dr
- 15070 S Lakeshore Rd
- 14781 S Lakeshore Rd
- 15071 S Lakeshore Rd
- 14808 Morning Sun Dr
- 14808 S Lakeshore Rd
- 14790 S Lakeshore Rd
- 15102 S Lakeshore Rd
- 15005 S Lakeshore Rd
- 14772 S Lakeshore Rd