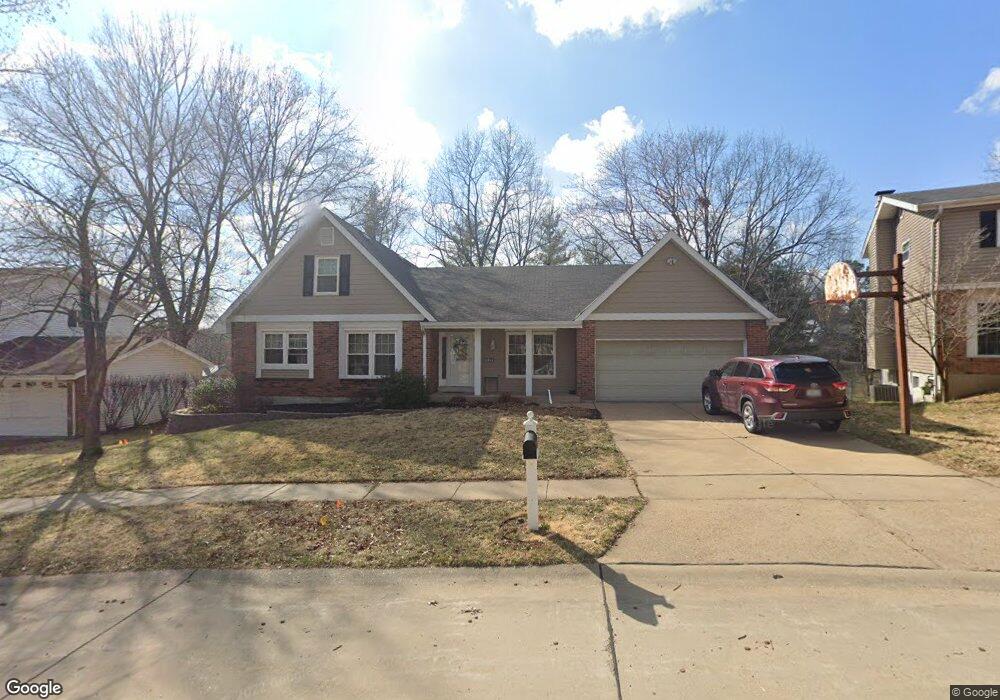
14944 Rutland Cir Chesterfield, MO 63017
Estimated Value: $529,065 - $575,000
5
Beds
3
Baths
2,683
Sq Ft
$205/Sq Ft
Est. Value
About This Home
This home is located at 14944 Rutland Cir, Chesterfield, MO 63017 and is currently estimated at $551,016, approximately $205 per square foot. 14944 Rutland Cir is a home located in St. Louis County with nearby schools including Shenandoah Valley Elementary, Parkway Central Middle School, and Parkway Central High School.
Ownership History
Date
Name
Owned For
Owner Type
Purchase Details
Closed on
Jan 16, 2004
Sold by
Kreyling Larry D and Kreyling Shirley K
Bought by
Rechtien Kenneth J and Rechtien Linda M
Current Estimated Value
Home Financials for this Owner
Home Financials are based on the most recent Mortgage that was taken out on this home.
Original Mortgage
$10,000
Outstanding Balance
$4,677
Interest Rate
5.9%
Mortgage Type
Credit Line Revolving
Estimated Equity
$546,339
Purchase Details
Closed on
Mar 25, 2002
Sold by
Schirmer J Robert and Russell Joan
Bought by
Kreyling Jason
Home Financials for this Owner
Home Financials are based on the most recent Mortgage that was taken out on this home.
Original Mortgage
$114,200
Interest Rate
6.83%
Mortgage Type
Balloon
Create a Home Valuation Report for This Property
The Home Valuation Report is an in-depth analysis detailing your home's value as well as a comparison with similar homes in the area
Home Values in the Area
Average Home Value in this Area
Purchase History
| Date | Buyer | Sale Price | Title Company |
|---|---|---|---|
| Rechtien Kenneth J | $257,900 | -- | |
| Kreyling Jason | $128,000 | -- |
Source: Public Records
Mortgage History
| Date | Status | Borrower | Loan Amount |
|---|---|---|---|
| Open | Rechtien Kenneth J | $10,000 | |
| Previous Owner | Kreyling Jason | $114,200 | |
| Closed | Rechtien Kenneth J | $206,300 |
Source: Public Records
Tax History Compared to Growth
Tax History
| Year | Tax Paid | Tax Assessment Tax Assessment Total Assessment is a certain percentage of the fair market value that is determined by local assessors to be the total taxable value of land and additions on the property. | Land | Improvement |
|---|---|---|---|---|
| 2025 | $5,243 | $80,670 | $44,270 | $36,400 |
| 2024 | $5,243 | $79,270 | $23,520 | $55,750 |
| 2023 | $5,243 | $79,270 | $23,520 | $55,750 |
| 2022 | $4,738 | $67,940 | $23,520 | $44,420 |
| 2021 | $4,719 | $67,940 | $23,520 | $44,420 |
| 2020 | $4,431 | $61,250 | $21,240 | $40,010 |
| 2019 | $235 | $61,250 | $21,240 | $40,010 |
| 2018 | $4,355 | $57,070 | $21,240 | $35,830 |
| 2017 | $1,036 | $57,070 | $21,240 | $35,830 |
| 2016 | $4,236 | $54,240 | $15,120 | $39,120 |
| 2015 | $7,205 | $54,240 | $15,120 | $39,120 |
| 2014 | $3,685 | $48,080 | $11,690 | $36,390 |
Source: Public Records
Map
Nearby Homes
- 15261 Springrun Dr
- 1226 Luray Dr
- 1251 Still House Creek Rd
- 14616 Rogue River Dr
- 15324 Appalachian Trail
- 14361 White Birch Valley Ln
- 1237 Cedar Creek Rd
- 384 Greentrails Dr S
- 1123 Cabinview Ct
- 14560 White Birch Valley Ln
- 1110 Nooning Tree Dr
- 14424 Valley Meadow Ct W
- 445 Whitestone Farm Dr
- 240 Greentrails Dr S
- 14663 Mallard Lake Dr
- 15509 Hitchcock Rd
- 1507 Timberlake Manor Pkwy
- 14629 Timberlake Manor Ct
- 14300 Conway Meadows Ct E Unit 302
- 15000 S Outer 40 Rd
- 14938 Rutland Cir
- 14950 Rutland Cir
- 14932 Rutland Cir
- 14956 Rutland Cir
- 14937 Rutland Cir
- 1260 Luray Dr
- 1264 Luray Dr
- 14961 Rutland Cir
- 14931 Rutland Cir
- 14962 Rutland Cir
- 1270 Luray Dr
- 1254 Luray Dr
- 1248 Traverton Dr
- 14940 Appalachian Trail
- 1249 Traverton Dr
- 14920 Rutland Cir
- 14925 Rutland Cir
- 1244 Traverton Dr
- 1278 Luray Dr
- 1250 Luray Dr