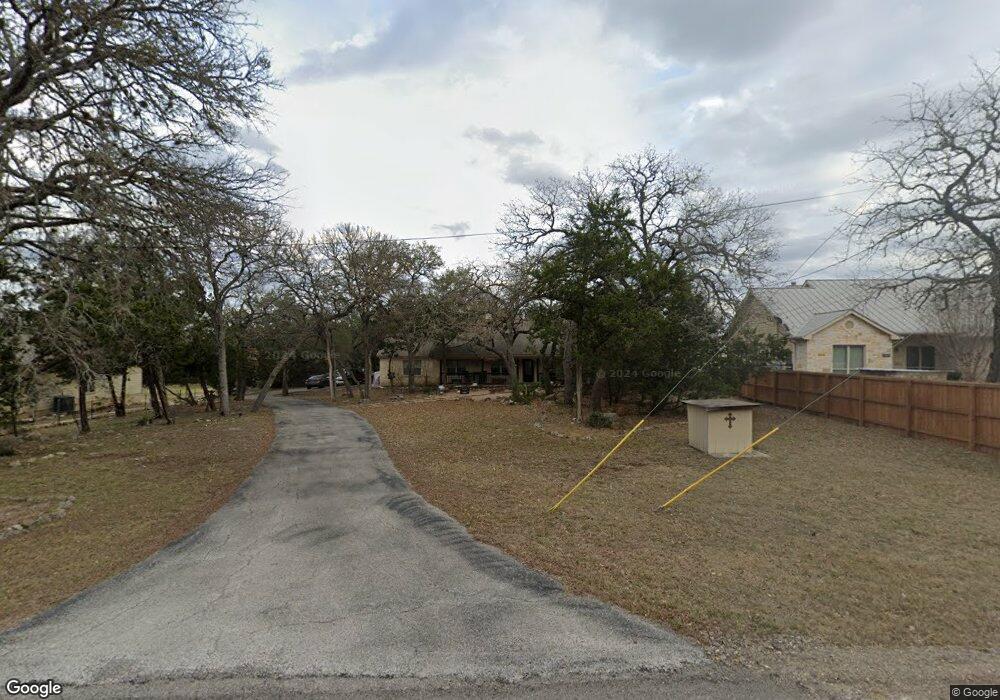
1495 Rolling River View Spring Branch, TX 78070
Estimated Value: $417,434 - $462,000
3
Beds
2
Baths
1,846
Sq Ft
$240/Sq Ft
Est. Value
About This Home
This home is located at 1495 Rolling River View, Spring Branch, TX 78070 and is currently estimated at $442,859, approximately $239 per square foot. 1495 Rolling River View is a home located in Comal County with nearby schools including Arlon R Seay Elementary School, Spring Branch Middle School, and Smithson Valley High School.
Ownership History
Date
Name
Owned For
Owner Type
Purchase Details
Closed on
Dec 19, 2014
Sold by
Rich Hoppe Enterprises Ltd
Bought by
Marshall Jennifer G
Current Estimated Value
Purchase Details
Closed on
Aug 24, 2010
Sold by
Marshall Richard
Bought by
Marshall Jennifer
Home Financials for this Owner
Home Financials are based on the most recent Mortgage that was taken out on this home.
Original Mortgage
$169,800
Interest Rate
4.55%
Mortgage Type
New Conventional
Purchase Details
Closed on
Sep 6, 2005
Sold by
Duggan James M and United Construction Services
Bought by
Marshall Richard and Marshall Jennifer
Home Financials for this Owner
Home Financials are based on the most recent Mortgage that was taken out on this home.
Original Mortgage
$179,025
Interest Rate
5.8%
Mortgage Type
New Conventional
Purchase Details
Closed on
Feb 7, 2004
Sold by
Droemer Janie E
Bought by
Duggan James M and United Construction Services
Create a Home Valuation Report for This Property
The Home Valuation Report is an in-depth analysis detailing your home's value as well as a comparison with similar homes in the area
Home Values in the Area
Average Home Value in this Area
Purchase History
| Date | Buyer | Sale Price | Title Company |
|---|---|---|---|
| Marshall Jennifer G | -- | Alamo Title | |
| Marshall Jennifer | -- | None Available | |
| Marshall Richard | -- | Multiple | |
| Duggan James M | -- | Multiple |
Source: Public Records
Mortgage History
| Date | Status | Borrower | Loan Amount |
|---|---|---|---|
| Previous Owner | Marshall Jennifer | $169,800 | |
| Previous Owner | Marshall Richard | $179,025 |
Source: Public Records
Tax History
| Year | Tax Paid | Tax Assessment Tax Assessment Total Assessment is a certain percentage of the fair market value that is determined by local assessors to be the total taxable value of land and additions on the property. | Land | Improvement |
|---|---|---|---|---|
| 2025 | $2,706 | $358,925 | -- | -- |
| 2024 | $2,706 | $326,295 | -- | -- |
| 2023 | $2,706 | $296,632 | $0 | $0 |
| 2022 | $2,828 | $390,400 | $94,860 | $295,540 |
| 2021 | $4,367 | $245,150 | $43,910 | $201,240 |
| 2020 | $4,420 | $238,550 | $43,910 | $194,640 |
| 2019 | $4,595 | $242,070 | $33,260 | $208,810 |
| 2018 | $4,152 | $219,330 | $27,720 | $191,610 |
| 2017 | $4,186 | $222,890 | $22,180 | $200,710 |
| 2016 | $3,981 | $211,970 | $22,180 | $189,790 |
Source: Public Records
Map
Nearby Homes
- 1191 Mossy Hollow Rd
- 1191 Mossy Hollow
- 2471 Rolling River View
- 1390 Misty Ln
- 1337 Valley Springs Dr
- 1270 Misty Ln
- 1005 Deep Water Dr
- 5250 Spring Branch Rd
- 660 Cypress Pass Rd
- 1204 Cypress Pass Rd
- 1025 Deep Water Dr
- 905 Cypress Pass Rd
- 875 Cypress Pass Rd
- 122 Lantana Cerro
- 2110 Phantom Rider Trail
- 174 Lantana Gold
- 175 Lantana Cerro
- 1638 Rolling Creek Rd
- 1790 Springwood Dr
- 815 Winding River Ln
- 1475 Rolling River View Unit VIEW
- 1475 Rolling River View
- 1515 Rolling River View
- 1535 Rolling River View
- 1435 Rolling River View
- 1510 Rolling River View
- 1555 Rolling River View
- 1293 Meadow Stream Dr
- 1337 Dragon Fly
- 1415 Rolling River View
- 609 Falling Water Dr
- 565 Falling Water Dr
- 565"A"-NEW LOT Falling Water Dr
- 1378 Rolling River View
- 1350 Dragon Fly
- 938 Shady Cove Ln
- 1655 Rolling River View
- 1330 Dragon Fly
- 1249 Dragon Fly
- 1310 Dragon Fly
Your Personal Tour Guide
Ask me questions while you tour the home.