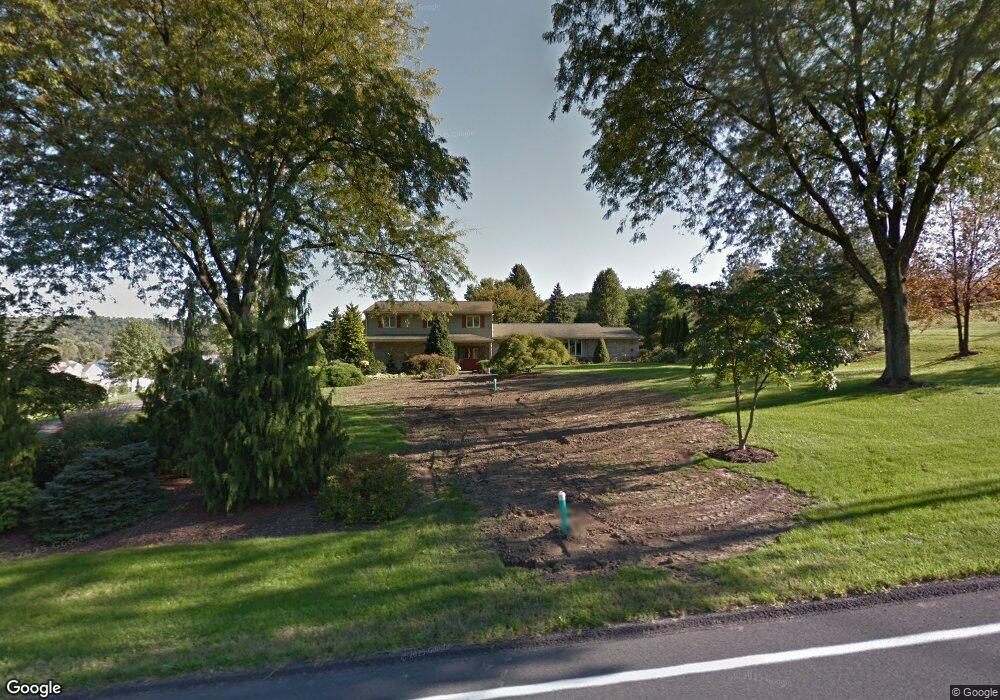
1496 Cedar Top Rd Reading, PA 19607
Estimated Value: $293,000 - $516,000
4
Beds
4
Baths
3,000
Sq Ft
$119/Sq Ft
Est. Value
About This Home
This home is located at 1496 Cedar Top Rd, Reading, PA 19607 and is currently estimated at $358,164, approximately $119 per square foot. 1496 Cedar Top Rd is a home located in Berks County with nearby schools including Governor Mifflin Intermediate School, Mifflin Park Elementary School, and Governor Mifflin Middle School.
Ownership History
Date
Name
Owned For
Owner Type
Purchase Details
Closed on
Mar 3, 2015
Sold by
Nelson Nancy R and Nelson Corey
Bought by
Nelson Nancy R
Current Estimated Value
Purchase Details
Closed on
Nov 16, 2011
Sold by
Sensenig Melvin L and Sensenig Cynthia N
Bought by
Nelson Corey and Nelson Nancy
Home Financials for this Owner
Home Financials are based on the most recent Mortgage that was taken out on this home.
Original Mortgage
$224,000
Outstanding Balance
$152,007
Interest Rate
3.92%
Mortgage Type
New Conventional
Estimated Equity
$206,157
Purchase Details
Closed on
Mar 14, 2005
Sold by
Albert Zeidman Geraldine L and Albert Geraldine L
Bought by
Sensenig Melvin L and Sensenig Cynthia N
Home Financials for this Owner
Home Financials are based on the most recent Mortgage that was taken out on this home.
Original Mortgage
$234,000
Interest Rate
5.95%
Mortgage Type
Fannie Mae Freddie Mac
Create a Home Valuation Report for This Property
The Home Valuation Report is an in-depth analysis detailing your home's value as well as a comparison with similar homes in the area
Home Values in the Area
Average Home Value in this Area
Purchase History
| Date | Buyer | Sale Price | Title Company |
|---|---|---|---|
| Nelson Nancy R | -- | None Available | |
| Nelson Corey | $280,000 | None Available | |
| Sensenig Melvin L | $444,775 | Fidelity Natl Title Ins Co |
Source: Public Records
Mortgage History
| Date | Status | Borrower | Loan Amount |
|---|---|---|---|
| Open | Nelson Corey | $224,000 | |
| Previous Owner | Sensenig Melvin L | $234,000 |
Source: Public Records
Tax History
| Year | Tax Paid | Tax Assessment Tax Assessment Total Assessment is a certain percentage of the fair market value that is determined by local assessors to be the total taxable value of land and additions on the property. | Land | Improvement |
|---|---|---|---|---|
| 2025 | $1,373 | $76,900 | $45,500 | $31,400 |
| 2024 | $3,538 | $76,900 | $45,500 | $31,400 |
| 2023 | $3,439 | $76,900 | $45,500 | $31,400 |
| 2022 | $3,353 | $76,900 | $45,500 | $31,400 |
| 2021 | $3,286 | $76,900 | $45,500 | $31,400 |
| 2020 | $3,286 | $76,900 | $45,500 | $31,400 |
| 2019 | $3,246 | $76,900 | $45,500 | $31,400 |
| 2018 | $3,188 | $76,900 | $45,500 | $31,400 |
| 2017 | $3,126 | $76,900 | $45,500 | $31,400 |
| 2016 | $1,197 | $76,900 | $45,500 | $31,400 |
| 2015 | $1,173 | $76,900 | $45,500 | $31,400 |
| 2014 | $1,173 | $76,900 | $45,500 | $31,400 |
Source: Public Records
Map
Nearby Homes
- 267 New Castle Dr
- 1 Overview Ct
- 512 Mifflin Blvd
- 0 Cedar Top Rd
- 135 Chestnut St
- 153 E Wyomissing Ave
- 508 S Sterley St
- 204 High Blvd
- 148 Main St
- 526 Harding Ave
- 26 E Mohn St
- 31 S Sterley St Unit 401
- 17 E Summit St
- 200 W Lancaster Ave
- 131 E Elm St
- 701 Tamarack Trail
- 42 Chestnut St
- 78 Chestnut St
- 405 State St
- 613 Leininger Ave
- 1478 Cedar Top Rd
- 1489 Cedar Top Rd
- 1503 Cedar Top Rd
- 1520 Cedar Top Rd
- 76 Harry Ave
- 74 Harry Ave
- 2 Albert Ln
- 72 Harry Ave
- 1461 Cedar Top Rd
- 1519 Cedar Top Rd
- 4 Albert Ln
- 70 Harry Ave
- 75 Harry Ave
- 73 Harry Ave
- 71 Harry Ave
- 81 Flint Ridge Dr
- 68 Harry Ave
- 79 Flint Ridge Dr
- 69 Harry Ave
- 1541 Cedar Top Rd
Your Personal Tour Guide
Ask me questions while you tour the home.