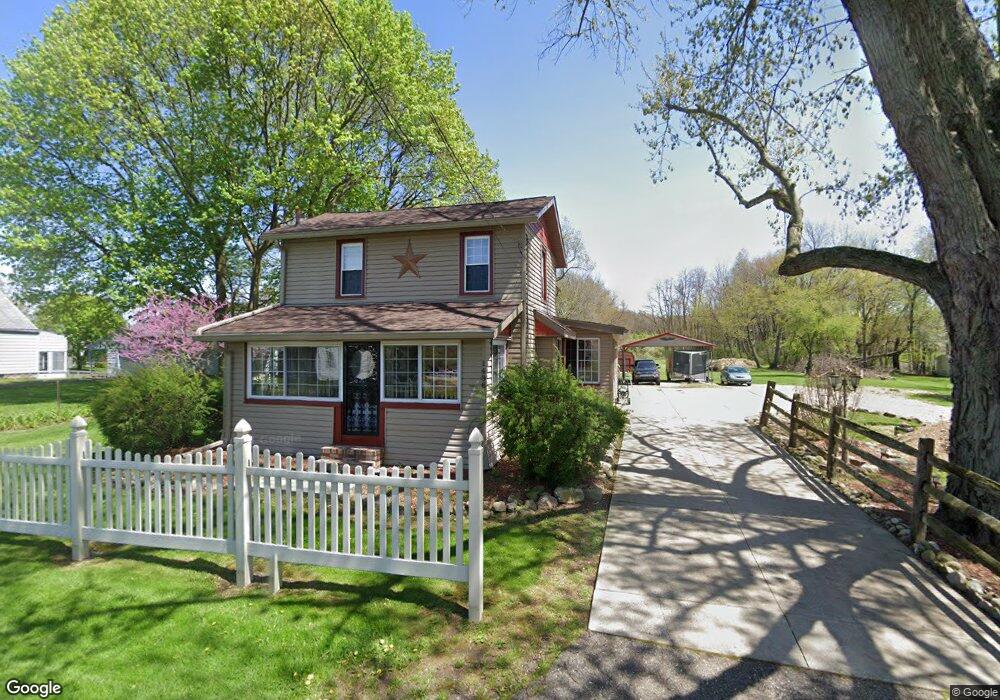
1496 Martin Rd Mogadore, OH 44260
Estimated Value: $200,000 - $253,000
4
Beds
1
Bath
1,543
Sq Ft
$150/Sq Ft
Est. Value
About This Home
This home is located at 1496 Martin Rd, Mogadore, OH 44260 and is currently estimated at $231,631, approximately $150 per square foot. 1496 Martin Rd is a home located in Portage County with nearby schools including Suffield Elementary School, Field Middle School, and Field High School.
Ownership History
Date
Name
Owned For
Owner Type
Purchase Details
Closed on
Mar 4, 2024
Sold by
Carpenter Skyler R
Bought by
Carpenter Sklyer R and Woodring Reed L
Current Estimated Value
Purchase Details
Closed on
Aug 9, 2023
Sold by
Rufener Melissa K
Bought by
Carpenter Skyler R
Home Financials for this Owner
Home Financials are based on the most recent Mortgage that was taken out on this home.
Original Mortgage
$160,256
Interest Rate
6.63%
Mortgage Type
FHA
Purchase Details
Closed on
Jul 19, 2023
Sold by
Rufener Robert G
Bought by
Rufener Melissa K
Home Financials for this Owner
Home Financials are based on the most recent Mortgage that was taken out on this home.
Original Mortgage
$160,256
Interest Rate
6.63%
Mortgage Type
FHA
Purchase Details
Closed on
Dec 10, 1991
Bought by
Rufener Robert G
Create a Home Valuation Report for This Property
The Home Valuation Report is an in-depth analysis detailing your home's value as well as a comparison with similar homes in the area
Home Values in the Area
Average Home Value in this Area
Purchase History
| Date | Buyer | Sale Price | Title Company |
|---|---|---|---|
| Carpenter Sklyer R | -- | None Listed On Document | |
| Carpenter Skyler R | $175,000 | Nova Title | |
| Rufener Melissa K | -- | None Listed On Document | |
| Rufener Robert G | $86,900 | -- |
Source: Public Records
Mortgage History
| Date | Status | Borrower | Loan Amount |
|---|---|---|---|
| Previous Owner | Carpenter Skyler R | $160,256 |
Source: Public Records
Tax History Compared to Growth
Tax History
| Year | Tax Paid | Tax Assessment Tax Assessment Total Assessment is a certain percentage of the fair market value that is determined by local assessors to be the total taxable value of land and additions on the property. | Land | Improvement |
|---|---|---|---|---|
| 2024 | $2,538 | $63,180 | $11,970 | $51,210 |
| 2023 | $2,560 | $51,140 | $9,240 | $41,900 |
| 2022 | $2,560 | $51,140 | $9,240 | $41,900 |
| 2021 | $2,547 | $51,140 | $9,240 | $41,900 |
| 2020 | $2,404 | $43,860 | $9,240 | $34,620 |
| 2019 | $2,412 | $43,860 | $9,240 | $34,620 |
| 2018 | $1,701 | $36,820 | $10,150 | $26,670 |
| 2017 | $1,701 | $36,820 | $10,150 | $26,670 |
| 2016 | $1,685 | $36,820 | $10,150 | $26,670 |
| 2015 | $1,686 | $36,820 | $10,150 | $26,670 |
| 2014 | $1,642 | $36,820 | $10,150 | $26,670 |
| 2013 | $1,629 | $36,820 | $10,150 | $26,670 |
Source: Public Records
Map
Nearby Homes
- 1660 Martin Rd
- 3985 Etter Rd
- 0 Martin Rd Unit 5159388
- 377 S Cleveland Ave
- 496 James Ave
- 3362 Brentwood Dr
- 0 Edith Ave Unit 5137069
- 1272 Portage Line Rd
- 1011 Sunrise Way
- 1379 Wood Fern Dr
- Aruba Bay w/ Basement Plan at Hidden Lake Villages - Hidden Lakes Ranches
- Grand Bahama w/ Basement Plan at Hidden Lake Villages - Hidden Lakes Ranches
- Eden Cay w/ Basement Plan at Hidden Lake Villages - Hidden Lakes Ranches
- Grand Cayman w/ Basement Plan at Hidden Lake Villages - Hidden Lakes Ranches
- 3874 Prospect St
- 3763 Orchard St
- 3702 Orchard St
- 754 Fettro Rd
- 1002 Bookman Ave
- 3736 Louise St