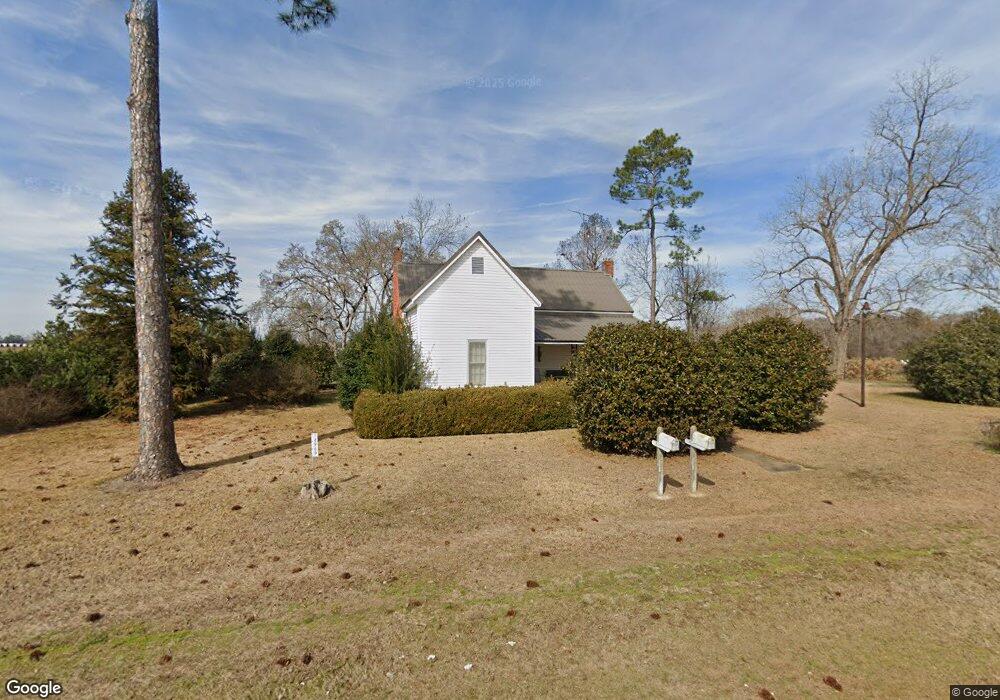
14969 Damascus Hilton Rd Blakely, GA 39823
Estimated Value: $114,000 - $122,000
--
Bed
1
Bath
1,884
Sq Ft
$62/Sq Ft
Est. Value
About This Home
This home is located at 14969 Damascus Hilton Rd, Blakely, GA 39823 and is currently estimated at $117,294, approximately $62 per square foot. 14969 Damascus Hilton Rd is a home located in Early County with nearby schools including Early County Elementary School, Early County Middle School, and Early County High School.
Ownership History
Date
Name
Owned For
Owner Type
Purchase Details
Closed on
Apr 29, 2019
Sold by
Jones Emery M
Bought by
Jones Shelton
Current Estimated Value
Home Financials for this Owner
Home Financials are based on the most recent Mortgage that was taken out on this home.
Original Mortgage
$41,202
Interest Rate
4%
Mortgage Type
New Conventional
Purchase Details
Closed on
Jun 18, 2018
Sold by
Jones
Bought by
Henderson Teresa Jones and Jones Emery M
Purchase Details
Closed on
Feb 8, 2008
Sold by
Jones Beverly Ann
Bought by
Middleton William Earl
Purchase Details
Closed on
Mar 23, 2007
Sold by
Jones Beverly Ann and Jones Emery
Bought by
Houston Robert T and Houston Gwen
Purchase Details
Closed on
Jun 1, 2006
Sold by
Jones Beverly Ann
Bought by
Langley Roscoe Earl
Purchase Details
Closed on
Dec 10, 2002
Sold by
Blackshear G S
Bought by
Jones Beverly A and Jones Em
Create a Home Valuation Report for This Property
The Home Valuation Report is an in-depth analysis detailing your home's value as well as a comparison with similar homes in the area
Home Values in the Area
Average Home Value in this Area
Purchase History
| Date | Buyer | Sale Price | Title Company |
|---|---|---|---|
| Jones Shelton | $60,000 | -- | |
| Henderson Teresa Jones | -- | -- | |
| Middleton William Earl | $198,497 | -- | |
| Houston Robert T | $80,000 | -- | |
| Langley Roscoe Earl | $83,111 | -- | |
| Jones Beverly A | -- | -- |
Source: Public Records
Mortgage History
| Date | Status | Borrower | Loan Amount |
|---|---|---|---|
| Closed | Jones Shelton | $41,202 |
Source: Public Records
Tax History Compared to Growth
Tax History
| Year | Tax Paid | Tax Assessment Tax Assessment Total Assessment is a certain percentage of the fair market value that is determined by local assessors to be the total taxable value of land and additions on the property. | Land | Improvement |
|---|---|---|---|---|
| 2024 | $893 | $33,140 | $7,761 | $25,379 |
| 2023 | $844 | $33,140 | $7,761 | $25,379 |
| 2022 | $808 | $32,037 | $6,939 | $25,098 |
| 2021 | $738 | $28,983 | $6,939 | $22,044 |
| 2020 | $692 | $27,675 | $6,939 | $20,736 |
| 2019 | $721 | $28,011 | $6,939 | $21,072 |
| 2018 | $669 | $28,011 | $6,939 | $21,072 |
| 2017 | $650 | $27,229 | $6,939 | $20,290 |
| 2016 | $675 | $25,328 | $6,939 | $18,389 |
| 2015 | -- | $24,268 | $5,880 | $18,389 |
| 2014 | -- | $24,269 | $5,880 | $18,389 |
| 2013 | -- | $24,664 | $5,880 | $18,784 |
Source: Public Records
Map
Nearby Homes
- 52 New Hope Rd
- 00 Stein Rd
- 74 Harmony Church Rd
- 1563 Ga Highway 27 N
- 745 Harmony Church Rd
- Pullen Rd
- 216 Willow Glen Dr
- 203 Willow Glen Dr
- 755 Mayhaw Rd
- 21141 Lucile Rd
- 934 Southside Dr
- 7507 Old Lucile Rd
- 18802 E South Blvd
- 74 S Lancelot St
- 000 Georgia 62
- 113 Crooked Oak Ln
- 300 N First St
- 0 Big Pond Rd
- 1545 Phillipsburg Rd
- Stein Rd
- 15038 Damascus Hilton Rd
- 14677 Damascus Hilton Rd
- 1815 New Hope Rd
- 14568 Damascus Hilton Rd
- 1678 New Hope Rd
- 15395 Damascus Hilton Rd
- 14457 Damascus Hilton Rd
- 659 Sandy Bottom Rd
- 707 Sandy Bottom Rd
- 326 Sandy Bottom Rd
- 757 Sandy Bottom Rd
- 1518 New Hope Rd
- 962 Sandy Bottom Rd
- 4050 Us Highway 27
- 4376 Us Highway 27
- 103 Sandy Bottom Rd
- 14225 Damascus Hilton Rd
- 1103 Sandy Bottom Rd
- 1015 New Hope Rd
- 1210 Sandy Bottom Rd