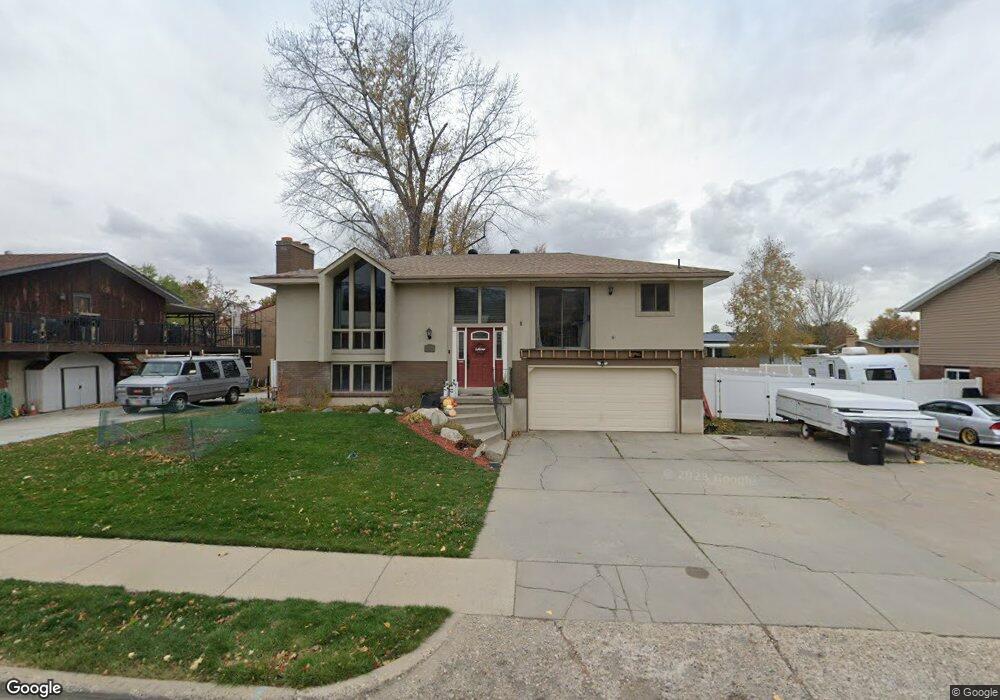
1497 N 675 W West Bountiful, UT 84087
Estimated Value: $491,000 - $526,000
3
Beds
3
Baths
2,384
Sq Ft
$214/Sq Ft
Est. Value
About This Home
This home is located at 1497 N 675 W, West Bountiful, UT 84087 and is currently estimated at $510,493, approximately $214 per square foot. 1497 N 675 W is a home located in Davis County with nearby schools including West Bountiful Elementary School, Bountiful Junior High School, and Viewmont High School.
Ownership History
Date
Name
Owned For
Owner Type
Purchase Details
Closed on
Dec 19, 2012
Sold by
Barlow Scott P
Bought by
Chaston Daniel L and Chaston Mckenna L
Current Estimated Value
Home Financials for this Owner
Home Financials are based on the most recent Mortgage that was taken out on this home.
Original Mortgage
$196,377
Outstanding Balance
$136,887
Interest Rate
3.5%
Mortgage Type
FHA
Estimated Equity
$373,606
Purchase Details
Closed on
Dec 4, 2009
Sold by
Barlow P Scot and Barlow Stephanie
Bought by
Barlow P Scot
Home Financials for this Owner
Home Financials are based on the most recent Mortgage that was taken out on this home.
Original Mortgage
$183,658
Interest Rate
5.01%
Mortgage Type
FHA
Purchase Details
Closed on
May 19, 2000
Sold by
Stout Jason G and Stout Kathleen A
Bought by
Barlow P Scot and Barlow Stephanie
Home Financials for this Owner
Home Financials are based on the most recent Mortgage that was taken out on this home.
Original Mortgage
$137,750
Interest Rate
8.22%
Create a Home Valuation Report for This Property
The Home Valuation Report is an in-depth analysis detailing your home's value as well as a comparison with similar homes in the area
Home Values in the Area
Average Home Value in this Area
Purchase History
| Date | Buyer | Sale Price | Title Company |
|---|---|---|---|
| Chaston Daniel L | -- | Inwest Title Services | |
| Barlow P Scot | -- | Utah First Title Ins Agenc | |
| Barlow P Scot | -- | Aspen Title Insurance Agency |
Source: Public Records
Mortgage History
| Date | Status | Borrower | Loan Amount |
|---|---|---|---|
| Open | Chaston Daniel L | $196,377 | |
| Previous Owner | Barlow P Scot | $183,658 | |
| Previous Owner | Barlow P Scot | $137,750 |
Source: Public Records
Tax History Compared to Growth
Tax History
| Year | Tax Paid | Tax Assessment Tax Assessment Total Assessment is a certain percentage of the fair market value that is determined by local assessors to be the total taxable value of land and additions on the property. | Land | Improvement |
|---|---|---|---|---|
| 2025 | $3,037 | $260,700 | $141,542 | $119,158 |
| 2024 | $2,837 | $249,700 | $116,437 | $133,263 |
| 2023 | $2,714 | $439,000 | $219,958 | $219,042 |
| 2022 | $2,744 | $248,600 | $105,752 | $142,848 |
| 2021 | $2,458 | $341,000 | $143,122 | $197,878 |
| 2020 | $2,124 | $290,000 | $132,434 | $157,566 |
| 2019 | $2,083 | $282,000 | $133,337 | $148,663 |
| 2018 | $1,936 | $258,000 | $133,086 | $124,914 |
| 2016 | $1,644 | $119,295 | $35,299 | $83,996 |
| 2015 | $1,583 | $109,395 | $35,299 | $74,096 |
| 2014 | $1,588 | $113,314 | $35,390 | $77,924 |
| 2013 | -- | $103,198 | $31,538 | $71,660 |
Source: Public Records
Map
Nearby Homes
- 637 W 1600 N
- 825 W 1320 N
- Lincoln Farmhouse Plan at Belmont Farms
- Belmont Traditional Plan at Belmont Farms
- Hampton Traditional Plan at Belmont Farms
- 741 W 845 N
- 366 W 1000 N
- 235 W 1400 N
- 790 N 500 W
- 548 S 675 W
- 239 Lyman Ln
- 2257 N 830 W
- 988 W 1950 N Unit 134
- 1084 W Audrey Ln Unit 20
- 1084 W Audrey Ln
- 668 W 2300 N
- 234 Leah Cir
- 1552 N 200 W
- 1410 N 200 W
- 1194 N 200 W