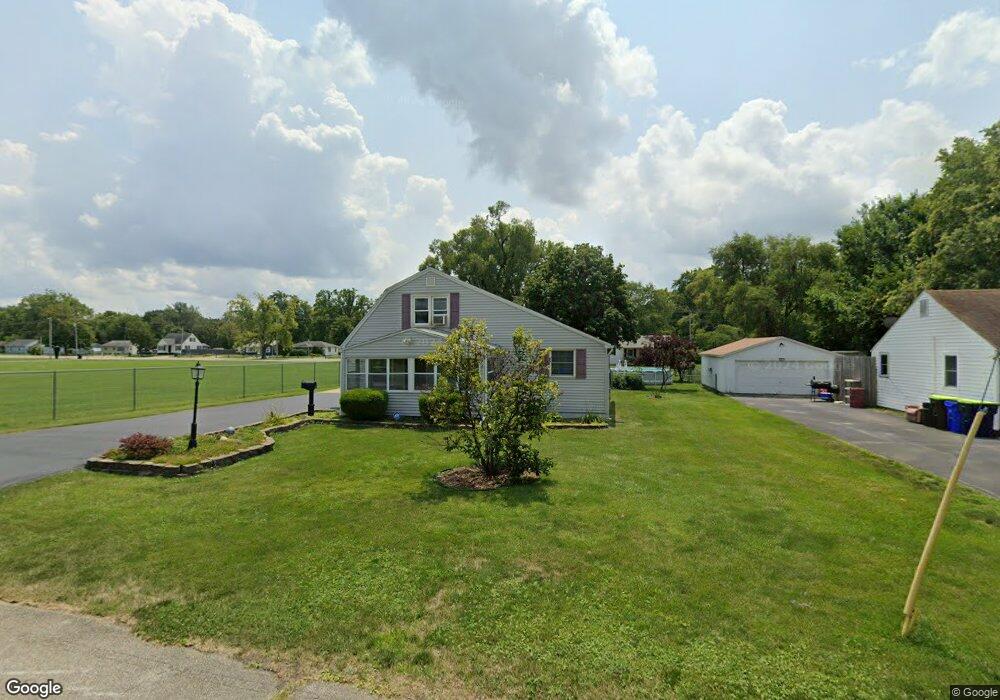
1497 W Hunt St Decatur, IL 62526
Ravina Park NeighborhoodEstimated Value: $67,000 - $108,000
3
Beds
1
Bath
1,676
Sq Ft
$54/Sq Ft
Est. Value
About This Home
This home is located at 1497 W Hunt St, Decatur, IL 62526 and is currently estimated at $90,469, approximately $53 per square foot. 1497 W Hunt St is a home located in Macon County with nearby schools including Stephen Decatur Middle School and Northwest Christian Campus.
Ownership History
Date
Name
Owned For
Owner Type
Purchase Details
Closed on
May 7, 2010
Sold by
Burcham Regina and Tucker Regina
Bought by
Campbell Nathaniel
Current Estimated Value
Home Financials for this Owner
Home Financials are based on the most recent Mortgage that was taken out on this home.
Original Mortgage
$62,227
Outstanding Balance
$41,892
Interest Rate
5.14%
Mortgage Type
FHA
Estimated Equity
$48,577
Purchase Details
Closed on
May 1, 2010
Home Financials for this Owner
Home Financials are based on the most recent Mortgage that was taken out on this home.
Original Mortgage
$62,227
Outstanding Balance
$41,892
Interest Rate
5.14%
Mortgage Type
FHA
Estimated Equity
$48,577
Purchase Details
Closed on
Aug 31, 2005
Sold by
Grubaugh Garold G and Grubaugh Alice S
Bought by
Tucker Regina
Home Financials for this Owner
Home Financials are based on the most recent Mortgage that was taken out on this home.
Original Mortgage
$55,114
Interest Rate
5.82%
Mortgage Type
FHA
Create a Home Valuation Report for This Property
The Home Valuation Report is an in-depth analysis detailing your home's value as well as a comparison with similar homes in the area
Home Values in the Area
Average Home Value in this Area
Purchase History
| Date | Buyer | Sale Price | Title Company |
|---|---|---|---|
| Campbell Nathaniel | $680,000 | None Available | |
| -- | $67,600 | -- | |
| Tucker Regina | $56,000 | None Available |
Source: Public Records
Mortgage History
| Date | Status | Borrower | Loan Amount |
|---|---|---|---|
| Open | Campbell Nathaniel | $62,227 | |
| Previous Owner | Tucker Regina | $55,114 |
Source: Public Records
Tax History Compared to Growth
Tax History
| Year | Tax Paid | Tax Assessment Tax Assessment Total Assessment is a certain percentage of the fair market value that is determined by local assessors to be the total taxable value of land and additions on the property. | Land | Improvement |
|---|---|---|---|---|
| 2024 | $2,331 | $30,076 | $2,563 | $27,513 |
| 2023 | $2,290 | $29,011 | $2,472 | $26,539 |
| 2022 | $1,797 | $23,569 | $2,932 | $20,637 |
| 2021 | $1,647 | $22,011 | $2,738 | $19,273 |
| 2020 | $1,594 | $20,989 | $2,611 | $18,378 |
| 2019 | $1,594 | $20,989 | $2,611 | $18,378 |
| 2018 | $1,410 | $19,416 | $1,754 | $17,662 |
| 2017 | $1,460 | $19,934 | $1,801 | $18,133 |
| 2016 | $1,494 | $20,137 | $1,819 | $18,318 |
| 2015 | $1,409 | $19,781 | $1,787 | $17,994 |
| 2014 | $1,302 | $19,585 | $1,769 | $17,816 |
| 2013 | $1,367 | $20,320 | $1,835 | $18,485 |
Source: Public Records
Map
Nearby Homes
- 1535 N Mcclellan Ave
- 1530 W Cushing St
- 1625 W Garfield Ave
- 1706 W Division St
- 1645 W Center St
- 1675 W Center St
- 1319 W Waggoner St
- 1415 N Dennis Ave
- 1524 N Summit Ave
- 1720 W Ravina Park Rd
- 933 W Division St
- 1451 W Marietta St
- 2273 N Fairview Ave
- 2125 Clearmont Ave
- 2121 Barding Ave
- 1607 W Melrose Ct
- 2131 N Oakcrest Ct
- 1929 W Ravina Park Rd
- 2195 W Center St
- 2192 W Waggoner St
- 1515 W Hunt St
- 1551 W Hunt St
- 1456 W Division St
- 1500 W Hunt St
- 1561 W Hunt St
- 1504 W Hunt St
- 1514 W Division St
- 1536 W Division St
- 1532 W Hunt St
- 1501 W Division St
- 1554 W Division St
- 1507 W Division St
- 1455 W Division St
- 1439 W Division St
- 1564 W Hunt St
- 1581 W Hunt St
- 1427 W Division St
- 1495 W Olive St
- 1503 W Olive St
- 1411 W Division St