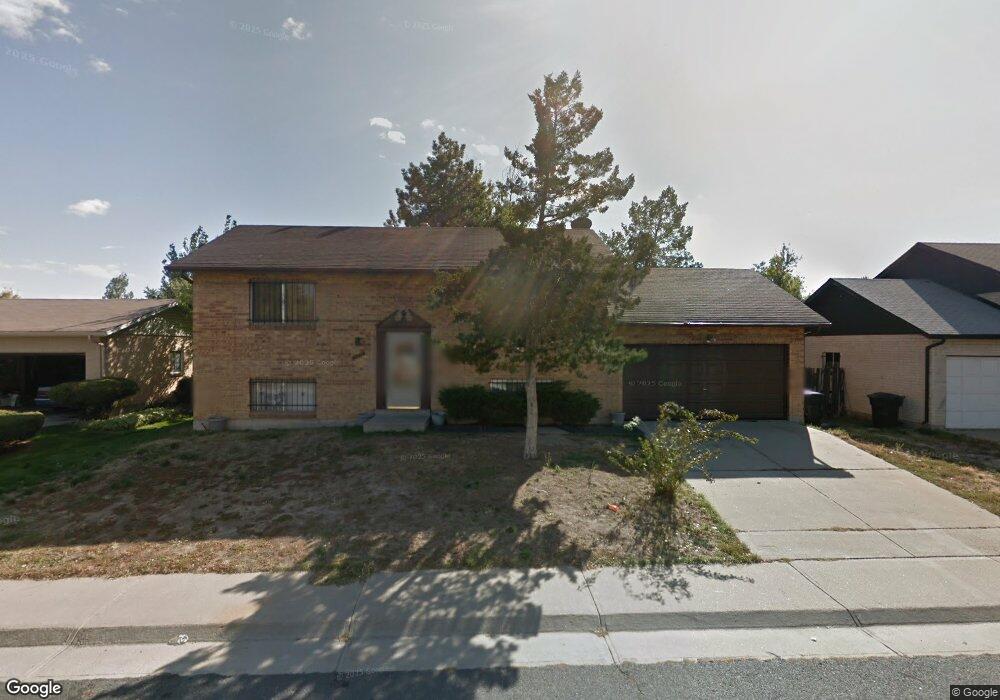
14972 Lackland Place Denver, CO 80239
Montbello NeighborhoodEstimated Value: $447,617 - $472,000
4
Beds
2
Baths
1,750
Sq Ft
$263/Sq Ft
Est. Value
About This Home
This home is located at 14972 Lackland Place, Denver, CO 80239 and is currently estimated at $459,404, approximately $262 per square foot. 14972 Lackland Place is a home located in Denver County with nearby schools including Dcis At Ford, McGlone Academy, and Pitt-Waller K-8 School.
Ownership History
Date
Name
Owned For
Owner Type
Purchase Details
Closed on
Dec 13, 2019
Sold by
Brooks Sonya
Bought by
Baker Amy Renee and Baker Beau
Current Estimated Value
Home Financials for this Owner
Home Financials are based on the most recent Mortgage that was taken out on this home.
Original Mortgage
$294,566
Outstanding Balance
$262,285
Interest Rate
4.12%
Mortgage Type
FHA
Estimated Equity
$197,119
Purchase Details
Closed on
Aug 22, 2007
Sold by
Beneficial Colorado Inc
Bought by
Brooks Sonya
Home Financials for this Owner
Home Financials are based on the most recent Mortgage that was taken out on this home.
Original Mortgage
$98,010
Interest Rate
8.5%
Mortgage Type
Purchase Money Mortgage
Purchase Details
Closed on
Mar 28, 2007
Sold by
Dishman William and Dishman Frances M
Bought by
Beneficial Mortgage Co Of Colorado
Purchase Details
Closed on
Aug 5, 1996
Sold by
Agency Remy
Bought by
Dishman William and Dishman Frances M
Create a Home Valuation Report for This Property
The Home Valuation Report is an in-depth analysis detailing your home's value as well as a comparison with similar homes in the area
Home Values in the Area
Average Home Value in this Area
Purchase History
| Date | Buyer | Sale Price | Title Company |
|---|---|---|---|
| Baker Amy Renee | $300,000 | First American Title | |
| Brooks Sonya | $108,900 | Fahtco | |
| Beneficial Mortgage Co Of Colorado | -- | None Available | |
| Dishman William | $13,750 | -- |
Source: Public Records
Mortgage History
| Date | Status | Borrower | Loan Amount |
|---|---|---|---|
| Open | Baker Amy Renee | $294,566 | |
| Previous Owner | Brooks Sonya | $98,010 |
Source: Public Records
Tax History Compared to Growth
Tax History
| Year | Tax Paid | Tax Assessment Tax Assessment Total Assessment is a certain percentage of the fair market value that is determined by local assessors to be the total taxable value of land and additions on the property. | Land | Improvement |
|---|---|---|---|---|
| 2024 | $2,108 | $26,610 | $1,050 | $25,560 |
| 2023 | $2,062 | $26,610 | $1,050 | $25,560 |
| 2022 | $1,829 | $23,000 | $4,910 | $18,090 |
| 2021 | $1,766 | $23,670 | $5,060 | $18,610 |
| 2020 | $1,623 | $21,880 | $5,060 | $16,820 |
| 2019 | $1,578 | $21,880 | $5,060 | $16,820 |
| 2018 | $1,306 | $16,880 | $3,050 | $13,830 |
| 2017 | $1,302 | $16,880 | $3,050 | $13,830 |
| 2016 | $1,055 | $12,940 | $2,818 | $10,122 |
| 2015 | $1,011 | $12,940 | $2,818 | $10,122 |
| 2014 | $748 | $9,010 | $1,990 | $7,020 |
Source: Public Records
Map
Nearby Homes
- 15053 Lackland Place
- 14804 Maxwell Place
- 5426 Eagle St
- 5342 Altura St
- 5251 Altura St
- 5553 Jasper St
- 14602 Randolph Place
- 14695 E 51st Place
- 5519 Chandler Ct
- 4050 N Kittredge St
- 15627 E 51st Dr
- 5542 Crown Blvd
- 15644 E 50th Ave
- 5549 Carson Way
- 5117 Kittredge St
- 5563 Blackhawk Way
- 16106 Randolph Place
- 14040 E 54th Ave
- 5044 Sable St
- 5109 Columbus Way
- 14942 Lackland Place
- 15022 Lackland Place
- 14973 Lackland Place
- 14943 Lackland Place
- 14961 E 55th Ave
- 15023 Lackland Place
- 15052 Lackland Place
- 14922 Lackland Place
- 15011 E 55th Ave
- 14933 Lackland Place
- 14911 E 55th Ave
- 15051 E 55th Ave
- 5506 Altura St
- 15072 Lackland Place
- 14902 Lackland Place
- 14923 Lackland Place
- 15073 Lackland Place
- 15071 E 55th Ave
- 15044 Maxwell Place
- 15064 Maxwell Place