Estimated Value: $381,548 - $465,000
--
Bed
--
Bath
2,446
Sq Ft
$175/Sq Ft
Est. Value
About This Home
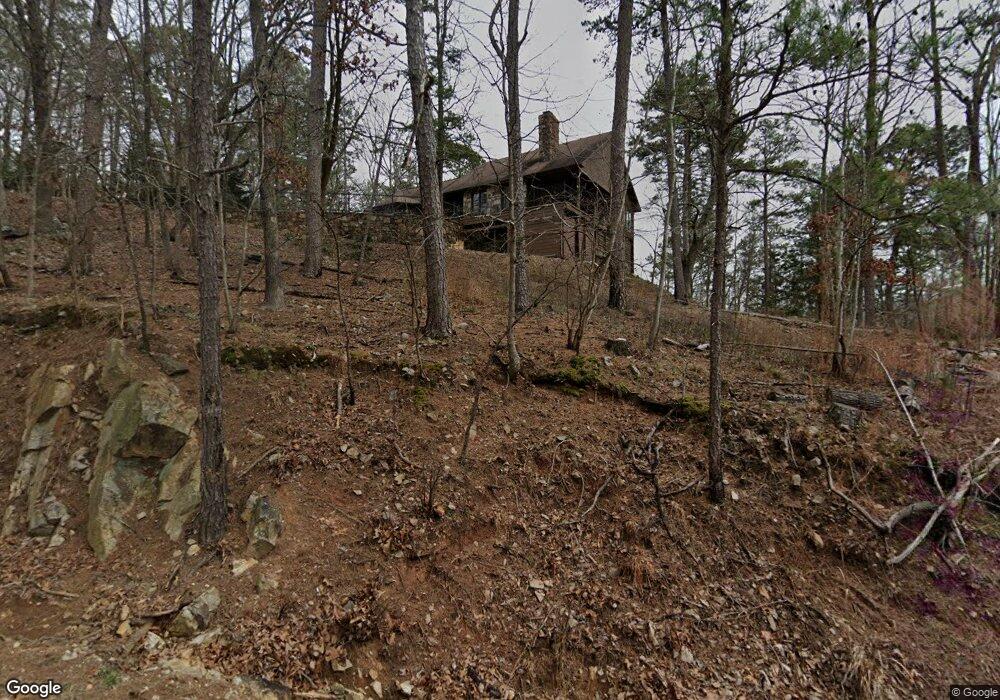
This home is located at 1499 Mount Alto Rd SW, Rome, GA 30165 and is currently estimated at $427,137, approximately $174 per square foot. 1499 Mount Alto Rd SW is a home located in Floyd County with nearby schools including Coosa Middle School and Coosa High School.
Ownership History
Date
Name
Owned For
Owner Type
Purchase Details
Closed on
Jul 31, 2002
Sold by
Vaughn Archie G and Vaughn Marie H
Bought by
Gay Donnie K and Gay Suzanne B
Current Estimated Value
Purchase Details
Closed on
Mar 24, 2000
Sold by
Cescutti
Bought by
Vaughn Archie G and Vaughn Marie H
Purchase Details
Closed on
Sep 21, 1991
Bought by
P and R
Purchase Details
Closed on
Jul 9, 1991
Bought by
P and R
Purchase Details
Closed on
Jul 5, 1985
Sold by
Cescutti Brad S
Bought by
Cescutti Brad S and Cescutti Rhonda
Purchase Details
Closed on
Jun 1, 1981
Sold by
Reeves David A
Bought by
Cescutti Brad S
Purchase Details
Closed on
Aug 16, 1979
Bought by
P and R
Purchase Details
Closed on
Aug 15, 1979
Sold by
Baird Timothy
Bought by
Reeves David A
Purchase Details
Closed on
Jul 20, 1979
Bought by
Baird Timothy
Create a Home Valuation Report for This Property
The Home Valuation Report is an in-depth analysis detailing your home's value as well as a comparison with similar homes in the area
Home Values in the Area
Average Home Value in this Area
Purchase History
| Date | Buyer | Sale Price | Title Company |
|---|---|---|---|
| Gay Donnie K | $195,900 | -- | |
| Vaughn Archie G | $185,000 | -- | |
| P | -- | -- | |
| P | -- | -- | |
| Cescutti Brad S | -- | -- | |
| Cescutti | -- | -- | |
| Cescutti Brad S | $5,900 | -- | |
| P | $4,200 | -- | |
| Reeves David A | $5,500 | -- | |
| Baird Timothy | -- | -- |
Source: Public Records
Tax History Compared to Growth
Tax History
| Year | Tax Paid | Tax Assessment Tax Assessment Total Assessment is a certain percentage of the fair market value that is determined by local assessors to be the total taxable value of land and additions on the property. | Land | Improvement |
|---|---|---|---|---|
| 2024 | $2,982 | $155,709 | $28,710 | $126,999 |
| 2023 | $3,114 | $161,644 | $26,100 | $135,544 |
| 2022 | $2,758 | $136,448 | $21,645 | $114,803 |
| 2021 | $2,591 | $124,666 | $19,724 | $104,942 |
| 2020 | $2,498 | $118,390 | $17,151 | $101,239 |
| 2019 | $2,251 | $106,756 | $17,151 | $89,605 |
| 2018 | $2,172 | $102,248 | $16,334 | $85,914 |
| 2017 | $2,065 | $96,216 | $15,124 | $81,092 |
| 2016 | $2,062 | $94,732 | $15,120 | $79,612 |
| 2015 | $1,990 | $94,732 | $15,120 | $79,612 |
| 2014 | $1,990 | $94,732 | $15,120 | $79,612 |
Source: Public Records
Map
Nearby Homes
- 0 Mt Alto Rd Sw Lot Unit WP001
- 4 Rivermont Dr SW
- 0 Radio Springs Rd SW Unit 10587646
- 0 Radio Springs Rd SW Unit 10587644
- 0 Radio Springs Rd SW Unit 10587642
- 30 Fairview Dr SW
- 10 Rivermont Dr SW
- 10 Horseshoe Bend Rd SW
- 3241 Horseleg Creek Rd SW
- 248 Smith Rd SW
- 3428 Horseleg Creek Rd SW
- 2 Kensington Rd SW
- 0 Roberts Rd SW Unit 10525813
- 0 Roberts Rd SW Unit 7582010
- 1 Windsor Rd SW
- 3 SW Highlander Trail SW
- 27 Stonebrook Dr SW
- 1 Huntington Rd SW
- 37 Willowrun Dr SW
- 1 Willowrun Dr SW
- 1487 Mount Alto Rd SW
- 1559 Mount Alto Rd SW
- 1419 Mount Alto Rd SW
- 1419 Mount Alto Rd SW
- 458 Radio Springs Rd SW
- 1401 Mount Alto Rd SW
- 1381 Mount Alto Rd SW
- 426 Radio Springs Rd SW
- 1363 Mount Alto Rd SW
- 1474 Mount Alto Rd SW
- 436 Radio Springs Rd SW
- 436 Radio Springs Rd SW
- 404 Radio Springs Rd SW
- 404 Radio Springs Rd SW
- 413 Radio Springs Rd SW
- 413 Radio Springs Rd SW
- 413 Radio Springs Rd SW
- 372 Radio Springs Rd SW
- 372 Radio Springs Rd SW
- 372 Radio Springs Rd SW