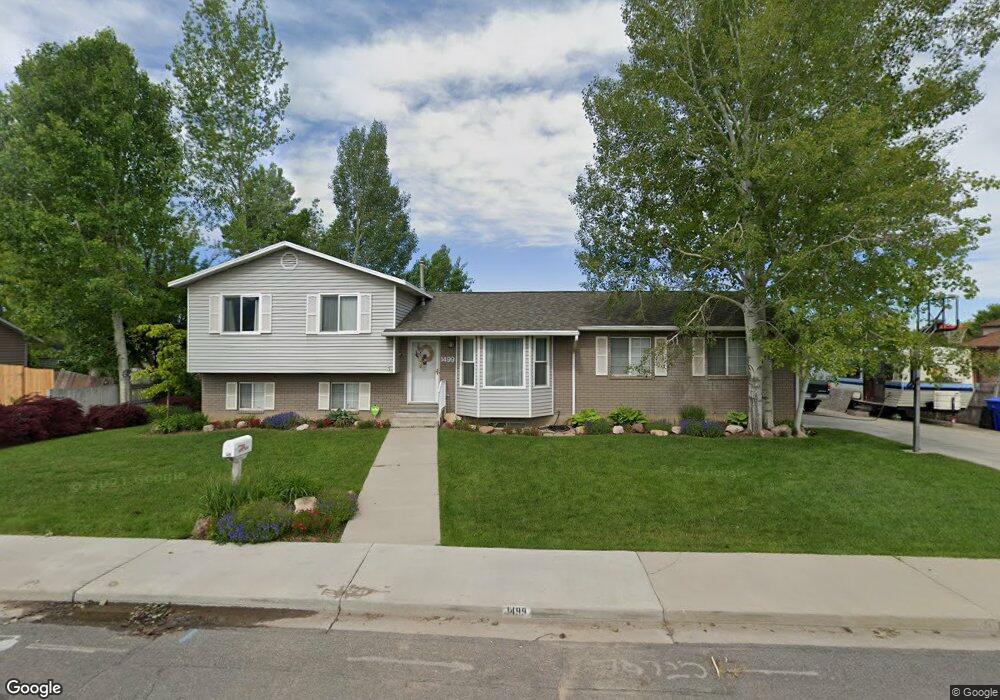
1499 N 950 W Orem, UT 84057
Aspen NeighborhoodEstimated Value: $526,000 - $568,612
4
Beds
4
Baths
2,251
Sq Ft
$243/Sq Ft
Est. Value
About This Home
This home is located at 1499 N 950 W, Orem, UT 84057 and is currently estimated at $545,903, approximately $242 per square foot. 1499 N 950 W is a home located in Utah County with nearby schools including Bonneville Elementary School, Orem Junior High School, and Timpanogos High School.
Ownership History
Date
Name
Owned For
Owner Type
Purchase Details
Closed on
Nov 26, 2002
Sold by
Park Gregory S and Park Chantilly
Bought by
Park Gregory S and Park Chantilly D
Current Estimated Value
Home Financials for this Owner
Home Financials are based on the most recent Mortgage that was taken out on this home.
Original Mortgage
$148,800
Interest Rate
6.28%
Purchase Details
Closed on
Sep 23, 1999
Sold by
Wing Douglas R and Wing Martha M
Bought by
Park Gregory S and Park Chantilly
Home Financials for this Owner
Home Financials are based on the most recent Mortgage that was taken out on this home.
Original Mortgage
$168,780
Interest Rate
7.5%
Create a Home Valuation Report for This Property
The Home Valuation Report is an in-depth analysis detailing your home's value as well as a comparison with similar homes in the area
Home Values in the Area
Average Home Value in this Area
Purchase History
| Date | Buyer | Sale Price | Title Company |
|---|---|---|---|
| Park Gregory S | -- | Inwest Title Services Inc | |
| Park Gregory S | -- | Mountain West Title Co |
Source: Public Records
Mortgage History
| Date | Status | Borrower | Loan Amount |
|---|---|---|---|
| Closed | Park Gregory S | $148,800 | |
| Closed | Park Gregory S | $168,780 | |
| Closed | Park Gregory S | $25,500 |
Source: Public Records
Tax History
| Year | Tax Paid | Tax Assessment Tax Assessment Total Assessment is a certain percentage of the fair market value that is determined by local assessors to be the total taxable value of land and additions on the property. | Land | Improvement |
|---|---|---|---|---|
| 2025 | $2,136 | $294,745 | -- | -- |
| 2024 | $2,136 | $261,140 | $0 | $0 |
| 2023 | $1,963 | $258,005 | $0 | $0 |
| 2022 | $2,067 | $263,230 | $0 | $0 |
| 2021 | $1,925 | $371,300 | $163,900 | $207,400 |
| 2020 | $1,764 | $334,400 | $131,100 | $203,300 |
| 2019 | $1,591 | $313,600 | $131,100 | $182,500 |
| 2018 | $1,516 | $285,500 | $119,900 | $165,600 |
| 2017 | $1,412 | $142,395 | $0 | $0 |
| 2016 | $1,429 | $132,935 | $0 | $0 |
| 2015 | $1,358 | $119,460 | $0 | $0 |
| 2014 | $1,302 | $114,015 | $0 | $0 |
Source: Public Records
Map
Nearby Homes
Your Personal Tour Guide
Ask me questions while you tour the home.