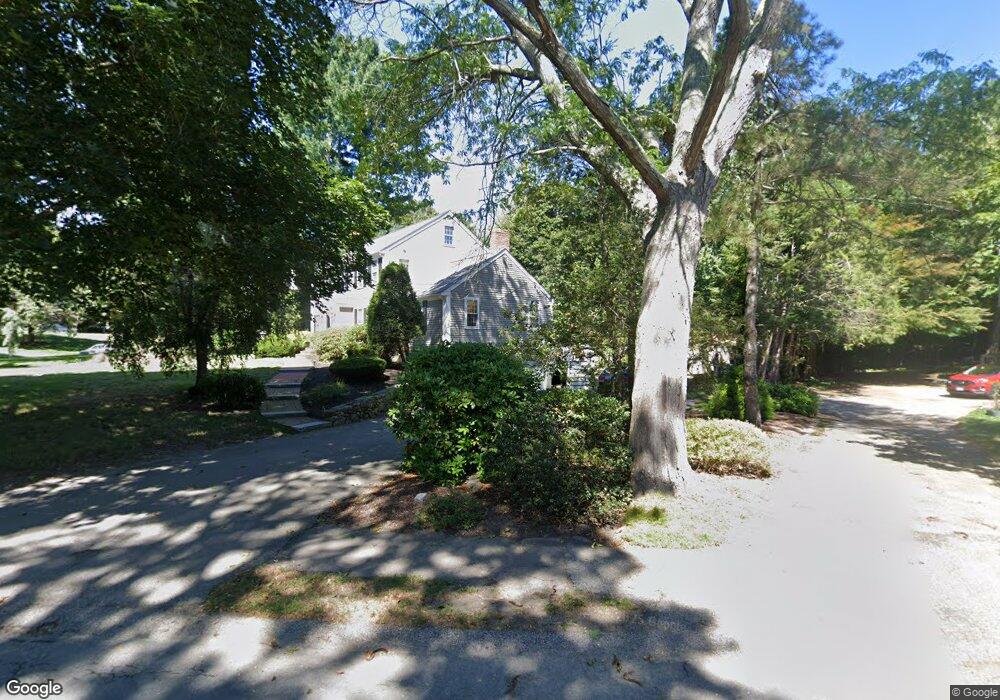
14A Chamberlain Run Hingham, MA 02043
Estimated Value: $1,507,000 - $1,571,000
4
Beds
3
Baths
2,530
Sq Ft
$607/Sq Ft
Est. Value
About This Home
This home is located at 14A Chamberlain Run, Hingham, MA 02043 and is currently estimated at $1,534,502, approximately $606 per square foot. 14A Chamberlain Run is a home located in Plymouth County with nearby schools including East Elementary School, Hingham Middle School, and Hingham High School.
Ownership History
Date
Name
Owned For
Owner Type
Purchase Details
Closed on
Jul 7, 2011
Sold by
Sullivan John A and Sullivan Mary M
Bought by
Mcgarr Kevin P and Mcgarr Adrienne S
Current Estimated Value
Home Financials for this Owner
Home Financials are based on the most recent Mortgage that was taken out on this home.
Original Mortgage
$625,500
Outstanding Balance
$440,142
Interest Rate
5%
Mortgage Type
Purchase Money Mortgage
Estimated Equity
$1,094,360
Create a Home Valuation Report for This Property
The Home Valuation Report is an in-depth analysis detailing your home's value as well as a comparison with similar homes in the area
Purchase History
| Date | Buyer | Sale Price | Title Company |
|---|---|---|---|
| Mcgarr Kevin P | $695,000 | -- |
Source: Public Records
Mortgage History
| Date | Status | Borrower | Loan Amount |
|---|---|---|---|
| Open | Mcgarr Kevin P | $625,500 |
Source: Public Records
Tax History
| Year | Tax Paid | Tax Assessment Tax Assessment Total Assessment is a certain percentage of the fair market value that is determined by local assessors to be the total taxable value of land and additions on the property. | Land | Improvement |
|---|---|---|---|---|
| 2025 | $13,280 | $1,242,300 | $484,800 | $757,500 |
| 2024 | $12,702 | $1,170,700 | $484,800 | $685,900 |
| 2023 | $10,843 | $1,084,300 | $484,800 | $599,500 |
| 2022 | $10,242 | $886,000 | $404,000 | $482,000 |
| 2021 | $4,816 | $844,600 | $404,000 | $440,600 |
| 2020 | $4,989 | $844,600 | $404,000 | $440,600 |
| 2019 | $9,650 | $817,100 | $404,000 | $413,100 |
| 2018 | $4,685 | $817,100 | $404,000 | $413,100 |
| 2017 | $9,328 | $761,500 | $404,000 | $357,500 |
| 2016 | $9,271 | $742,300 | $384,800 | $357,500 |
| 2015 | $9,072 | $724,000 | $366,500 | $357,500 |
Source: Public Records
Map
Nearby Homes
- 14 Chamberlain Run
- 69 East St
- 77 East St
- 12 Chamberlain Run
- 16 Chamberlain Run
- 2 Joy Ln
- 10 Chamberlain Run
- 18 Chamberlain Run
- 8 Chamberlain Run
- 15 Chamberlain Run
- 20 Chamberlain Run
- 6 Chamberlain Run
- 61 East St
- 19 Chamberlain Run
- 22 Chamberlain Run
- 17 Chamberlain Run
- 11 Chamberlain Run
- 88 East St
- 3 Rockwood Rd
- 21 Chamberlain Run
Your Personal Tour Guide
Ask me questions while you tour the home.