Estimated Value: $222,000 - $259,000
3
Beds
2
Baths
1,056
Sq Ft
$224/Sq Ft
Est. Value
About This Home
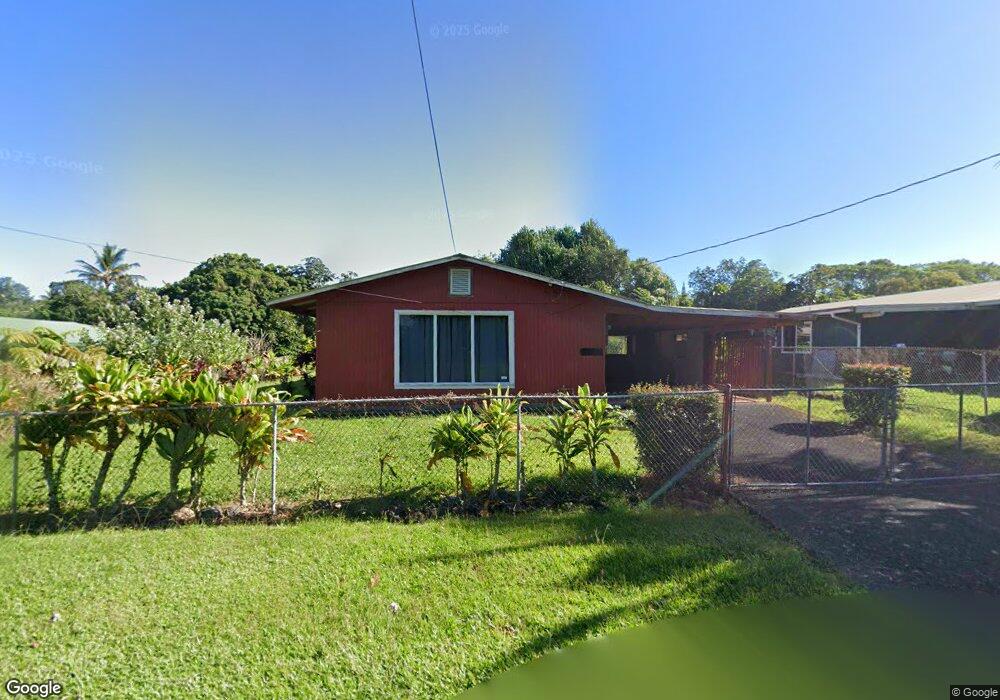
This home is located at 15-175 Puni Paka Loop N, Pahoa, HI 96778 and is currently estimated at $236,186, approximately $223 per square foot. 15-175 Puni Paka Loop N is a home located in Hawaii County with nearby schools including Keonepoko Elementary School and Pahoa Intermediate/High School.
Ownership History
Date
Name
Owned For
Owner Type
Purchase Details
Closed on
Jul 31, 2019
Sold by
Sako Deanna
Bought by
Better Living Llc
Current Estimated Value
Purchase Details
Closed on
Jul 18, 2014
Sold by
Deutsche Bank National Trust Company
Bought by
Miller Donald
Purchase Details
Closed on
Jan 3, 2014
Sold by
Nakamoto Henry
Bought by
Deutsche Bank National Trust Company
Purchase Details
Closed on
Nov 13, 2006
Sold by
Demello Antoinette Marie
Bought by
Kalilikane Denise Harriet
Home Financials for this Owner
Home Financials are based on the most recent Mortgage that was taken out on this home.
Original Mortgage
$108,800
Interest Rate
7.62%
Mortgage Type
Balloon
Purchase Details
Closed on
Oct 27, 2004
Sold by
Ford Michael Steven and Ford Darlene Yen Li
Bought by
Demello Antoinette Marie
Home Financials for this Owner
Home Financials are based on the most recent Mortgage that was taken out on this home.
Original Mortgage
$94,050
Interest Rate
7.75%
Mortgage Type
Purchase Money Mortgage
Create a Home Valuation Report for This Property
The Home Valuation Report is an in-depth analysis detailing your home's value as well as a comparison with similar homes in the area
Home Values in the Area
Average Home Value in this Area
Purchase History
| Date | Buyer | Sale Price | Title Company |
|---|---|---|---|
| Better Living Llc | $1,774 | None Available | |
| Miller Donald | $88,079 | Fidelity National Title & Es | |
| Deutsche Bank National Trust Company | $60,000 | None Available | |
| Kalilikane Denise Harriet | $136,000 | None Available | |
| Demello Antoinette Marie | $99,000 | -- |
Source: Public Records
Mortgage History
| Date | Status | Borrower | Loan Amount |
|---|---|---|---|
| Previous Owner | Kalilikane Denise Harriet | $108,800 | |
| Previous Owner | Demello Antoinette Marie | $94,050 |
Source: Public Records
Tax History Compared to Growth
Tax History
| Year | Tax Paid | Tax Assessment Tax Assessment Total Assessment is a certain percentage of the fair market value that is determined by local assessors to be the total taxable value of land and additions on the property. | Land | Improvement |
|---|---|---|---|---|
| 2025 | $356 | $61,700 | $13,200 | $48,500 |
| 2024 | $356 | $59,900 | $13,200 | $46,700 |
| 2023 | $358 | $58,200 | $13,200 | $45,000 |
| 2022 | $347 | $56,500 | $13,200 | $43,300 |
| 2021 | $338 | $54,900 | $13,200 | $41,700 |
| 2020 | $663 | $59,700 | $14,900 | $44,800 |
| 2019 | $1,526 | $137,500 | $12,600 | $124,900 |
| 2018 | $1,274 | $114,800 | $13,400 | $101,400 |
| 2017 | $1,116 | $100,500 | $12,700 | $87,800 |
| 2016 | $992 | $98,700 | $12,700 | $86,000 |
| 2015 | -- | $87,700 | $12,800 | $74,900 |
| 2014 | -- | $102,700 | $13,700 | $89,000 |
Source: Public Records
Map
Nearby Homes
- 0 N Opihi St Unit 722213
- 0 Palani St Unit 723933
- 0 Palani St Unit 720042
- 0 Palani St Unit 703817
- 15-180 Puni Kahakai Loop S
- 15 Opelu St
- 15-168 Puni Kahakai Loop N
- 15-167 Puni Paka Loop S
- 15-2691 Opelu St
- 15-2710 Palani St
- 15-2753 Opihi St
- 0 Papai St
- 15-2791 Papai St
- 15-2793 Papai St
- 15-136 Alu Lepe St
- 15-2714 Opakapaka St
- 0 Opakapaka St Unit 723761
- 0 Opakapaka St Unit 723497
- 0 Alu Lepe St
- 15-2761 Opihi St
- 15-173 Puni Paka Loop N
- 15-175 Puni Paka Loop S
- 15-169 Puni Paka Loop N
- 15-174 Puni Paka Loop S
- 15-179 Puni Paka Loop N
- 15-176 Puni Paka Loop S
- 15-180 Puni Lani Loop N
- 15-170 Puni Paka Loop S
- 15-180 Puni Paka Loop S
- 15-167 Puni Paka Loop N
- 15-168 Puni Paka Loop S
- 15-181 Puni Paka Loop N
- 15-182 Puni Paka Loop S
- 15-2719 Opelu St
- 15-165 Puni Paka Loop N
- 15-2759 Opihi St
- 15-166 Puni Paka Loop S
- 15-185 Puni Paka Loop S
- 15-185 Puni Paka Loop N
- 15 Puni Paka Loop S