Estimated Value: $281,000 - $431,000
3
Beds
2
Baths
1,152
Sq Ft
$285/Sq Ft
Est. Value
About This Home
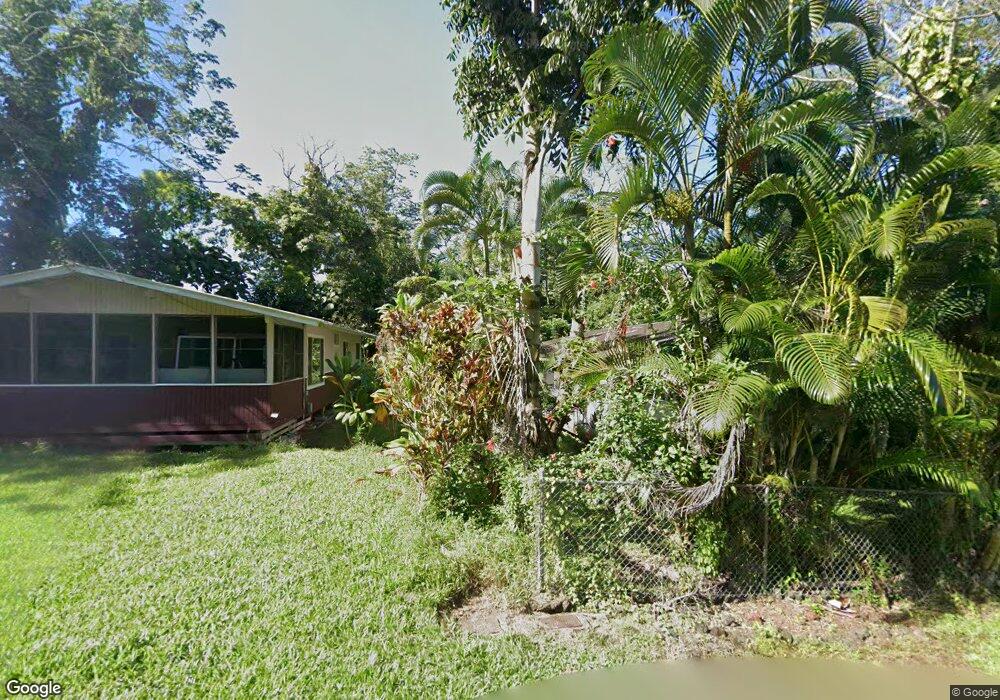
This home is located at 15-176 Puni Lani Loop S, Pahoa, HI 96778 and is currently estimated at $328,257, approximately $284 per square foot. 15-176 Puni Lani Loop S is a home located in Hawaii County with nearby schools including Keonepoko Elementary School and Pahoa Intermediate/High School.
Ownership History
Date
Name
Owned For
Owner Type
Purchase Details
Closed on
Jan 31, 2007
Sold by
White Jeffrey and White Judi
Bought by
Cerny David Leroy
Current Estimated Value
Home Financials for this Owner
Home Financials are based on the most recent Mortgage that was taken out on this home.
Original Mortgage
$225,000
Outstanding Balance
$134,840
Interest Rate
6.17%
Mortgage Type
Purchase Money Mortgage
Estimated Equity
$193,417
Purchase Details
Closed on
Aug 27, 2004
Sold by
Alanis Wooden Boyd Franklin and Alanis Wooden Josey
Bought by
White Jeffrey and White Judi
Purchase Details
Closed on
Jun 5, 2000
Sold by
Orimoto Tina Geri
Bought by
Alanis Wooden Boyd Franklin and Alanis Wooden Josey
Home Financials for this Owner
Home Financials are based on the most recent Mortgage that was taken out on this home.
Original Mortgage
$40,850
Interest Rate
7%
Mortgage Type
Purchase Money Mortgage
Purchase Details
Closed on
Nov 2, 1994
Sold by
Johnson David Allan
Bought by
Nunes Warren Wade
Create a Home Valuation Report for This Property
The Home Valuation Report is an in-depth analysis detailing your home's value as well as a comparison with similar homes in the area
Home Values in the Area
Average Home Value in this Area
Purchase History
| Date | Buyer | Sale Price | Title Company |
|---|---|---|---|
| Cerny David Leroy | $225,000 | None Available | |
| White Jeffrey | $99,000 | -- | |
| Alanis Wooden Boyd Franklin | $43,000 | First American Long & Melone | |
| Nunes Warren Wade | $52,000 | -- |
Source: Public Records
Mortgage History
| Date | Status | Borrower | Loan Amount |
|---|---|---|---|
| Open | Cerny David Leroy | $225,000 | |
| Previous Owner | Alanis Wooden Boyd Franklin | $40,850 |
Source: Public Records
Tax History Compared to Growth
Tax History
| Year | Tax Paid | Tax Assessment Tax Assessment Total Assessment is a certain percentage of the fair market value that is determined by local assessors to be the total taxable value of land and additions on the property. | Land | Improvement |
|---|---|---|---|---|
| 2025 | $1,904 | $174,200 | $17,700 | $156,500 |
| 2024 | $1,904 | $171,500 | $22,500 | $149,000 |
| 2023 | $298 | $123,100 | $12,600 | $110,500 |
| 2022 | $342 | $119,500 | $12,600 | $106,900 |
| 2021 | $325 | $116,000 | $12,600 | $103,400 |
| 2020 | $308 | $112,600 | $12,600 | $100,000 |
| 2019 | $292 | $109,300 | $12,600 | $96,700 |
| 2018 | $276 | $106,100 | $12,700 | $93,400 |
| 2017 | $261 | $103,000 | $12,700 | $90,300 |
| 2016 | $246 | $100,000 | $12,700 | $87,300 |
| 2015 | -- | $97,100 | $12,800 | $84,300 |
| 2014 | -- | $112,600 | $13,700 | $98,900 |
Source: Public Records
Map
Nearby Homes
- 15-2761 Opihi St
- 15-175 N Puni Lapa Loop
- 15-2753 Opihi St
- 0 Puhi St
- 0 Opakapaka St Unit 723761
- 0 Opakapaka St Unit 723497
- 15-2714 Opakapaka St
- 0 S Opae St Unit 724441
- 0 S Opae St Unit 723487
- 0 S Opae St Unit 723149
- 15-2811 Puhi St
- 0 Papai St
- 15-2791 Papai St
- 15-2793 Papai St
- 15-2792 Opae St
- 15-167 Puni Paka Loop S
- 15-2710 Palani St
- 15-2783 Popaa St
- 0 S Puna Pkwy Unit 719555
- 15-123 Uwalo St
- 15-180 Puni Lani Loop S
- 15-154 Puni Lani Loop S
- 15-2782 Opihi St
- 15-2784 Opihi St
- 15-167 Puni Lani Loop N
- 15-185 Puni Lani Loop N
- 0 Puni Lani Lp Unit 613997
- 0 Puni Lani Lp Unit 613352
- 0 Puni Lani Lp Unit 614006
- 0 Puni Lani Lp Unit 604099
- 0 Puni Lani Lp Unit 630250
- 0 Puni Lani Lp Unit 630251
- 0 Puni Lani Lp Unit 652574
- 0 Puni Lani Lp Unit 657265
- 0 Puni Lani Lp Unit 661149
- 0 Puni Lani Loop Unit 710162
- 15-2786 Opihi St
- 15-2761 Opihi St Unit Lot 1710
- 15-165 Puni Lani Loop N
- 0 Opelu St