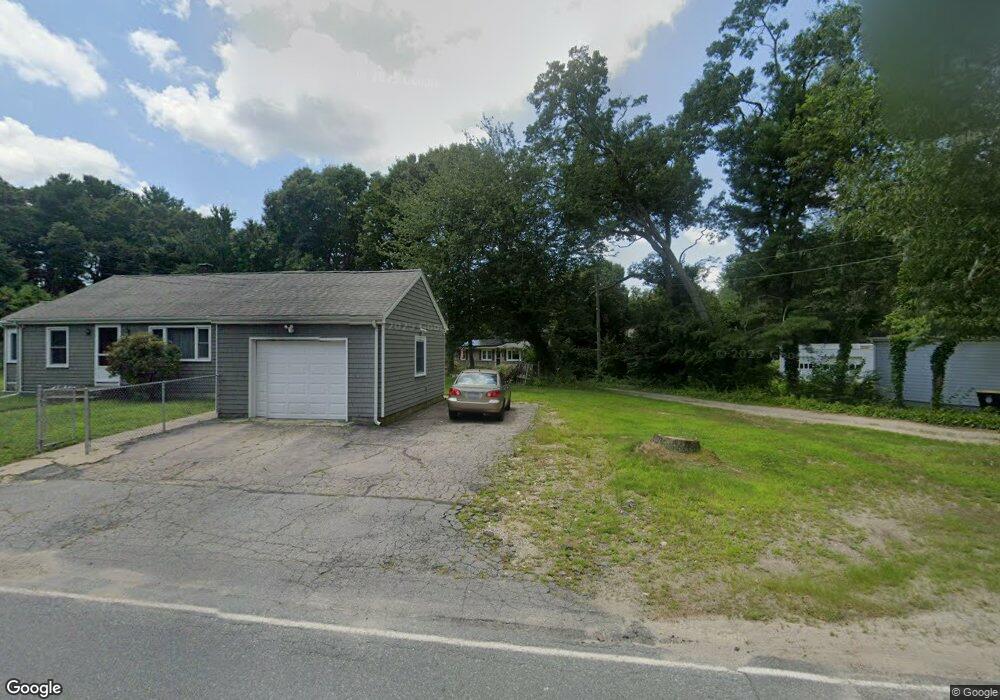
15 3rd Ave Acushnet, MA 02743
Upper Acushnet NeighborhoodEstimated Value: $441,000 - $460,081
Studio
2
Baths
1,056
Sq Ft
$427/Sq Ft
Est. Value
About This Home
This home is located at 15 3rd Ave, Acushnet, MA 02743 and is currently estimated at $450,520, approximately $426 per square foot. 15 3rd Ave is a home located in Bristol County with nearby schools including Acushnet Elementary School, Albert F Ford Middle School, and Alma del Mar Charter School.
Ownership History
Date
Name
Owned For
Owner Type
Purchase Details
Closed on
Sep 8, 2023
Sold by
Reale Michele T and Reale Olga M
Bought by
Mo Reale Irt and Reale
Current Estimated Value
Purchase Details
Closed on
Oct 8, 1992
Sold by
Pringle James L
Bought by
Reale Michael T and Reale Olga M
Home Financials for this Owner
Home Financials are based on the most recent Mortgage that was taken out on this home.
Original Mortgage
$75,000
Interest Rate
7.99%
Mortgage Type
Purchase Money Mortgage
Create a Home Valuation Report for This Property
The Home Valuation Report is an in-depth analysis detailing your home's value as well as a comparison with similar homes in the area
Home Values in the Area
Average Home Value in this Area
Purchase History
| Date | Buyer | Sale Price | Title Company |
|---|---|---|---|
| Mo Reale Irt | -- | None Available | |
| Reale Michael T | $10,500 | -- |
Source: Public Records
Mortgage History
| Date | Status | Borrower | Loan Amount |
|---|---|---|---|
| Previous Owner | Reale Michael T | $110,000 | |
| Previous Owner | Reale Michael T | $22,000 | |
| Previous Owner | Reale Michael T | $72,000 | |
| Previous Owner | Reale Michael T | $75,000 |
Source: Public Records
Tax History
| Year | Tax Paid | Tax Assessment Tax Assessment Total Assessment is a certain percentage of the fair market value that is determined by local assessors to be the total taxable value of land and additions on the property. | Land | Improvement |
|---|---|---|---|---|
| 2025 | $4,124 | $382,200 | $129,000 | $253,200 |
| 2024 | $3,946 | $345,800 | $122,200 | $223,600 |
| 2023 | $3,830 | $319,200 | $110,900 | $208,300 |
| 2022 | $3,830 | $288,600 | $104,100 | $184,500 |
| 2021 | $3,433 | $267,400 | $104,100 | $163,300 |
| 2020 | $3,287 | $260,600 | $97,300 | $163,300 |
| 2019 | $3,534 | $249,200 | $92,800 | $156,400 |
| 2018 | $5,800 | $237,800 | $92,800 | $145,000 |
| 2017 | $3,315 | $229,600 | $92,800 | $136,800 |
| 2016 | $3,268 | $224,900 | $92,800 | $132,100 |
| 2015 | $3,107 | $217,600 | $92,800 | $124,800 |
Source: Public Records
Map
Nearby Homes
Your Personal Tour Guide
Ask me questions while you tour the home.