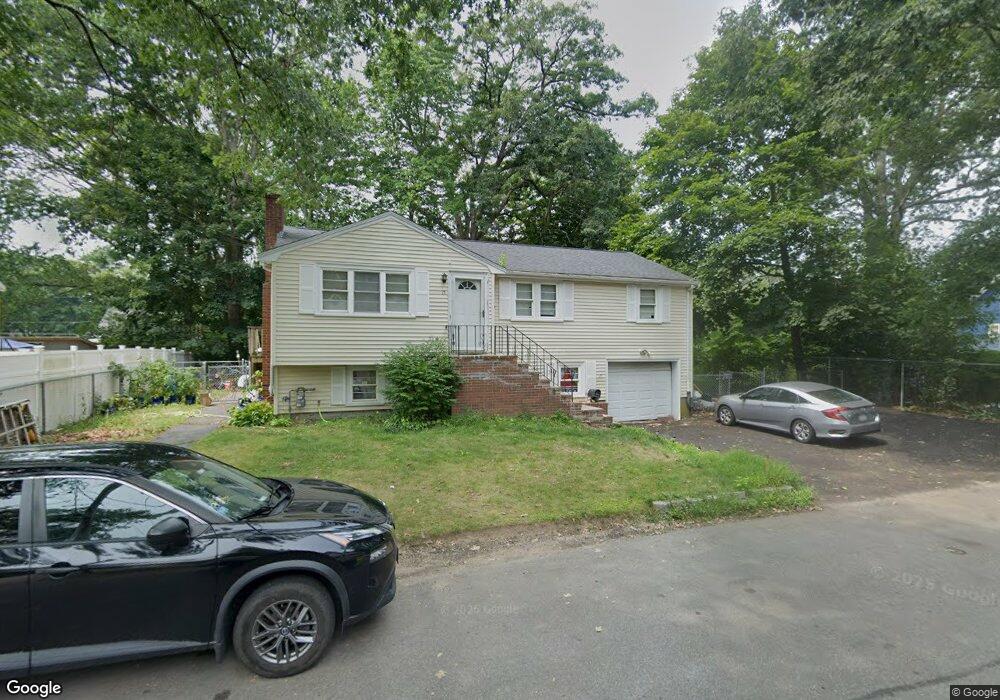
15 Agnew Ave Brockton, MA 02301
Clifton Heights NeighborhoodEstimated Value: $529,743 - $608,000
4
Beds
2
Baths
1,977
Sq Ft
$286/Sq Ft
Est. Value
About This Home
This home is located at 15 Agnew Ave, Brockton, MA 02301 and is currently estimated at $566,186, approximately $286 per square foot. 15 Agnew Ave is a home located in Plymouth County with nearby schools including Manthala George Jr. School, Louis F Angelo Elementary School, and Raymond K-8 Elementary School.
Ownership History
Date
Name
Owned For
Owner Type
Purchase Details
Closed on
Jul 23, 2021
Sold by
Mmag 2 Llc
Bought by
Asack Marta K and Asack Louis G
Current Estimated Value
Home Financials for this Owner
Home Financials are based on the most recent Mortgage that was taken out on this home.
Original Mortgage
$167,000
Outstanding Balance
$126,061
Interest Rate
2.23%
Mortgage Type
Stand Alone Refi Refinance Of Original Loan
Estimated Equity
$440,125
Purchase Details
Closed on
Jan 22, 2020
Sold by
Asack Louis G and Asack Marta K
Bought by
Mmag 2 Llc
Purchase Details
Closed on
Jun 20, 2012
Sold by
Louis 3Rd G A
Bought by
Louis 3Rd G A and Asack Marta K
Home Financials for this Owner
Home Financials are based on the most recent Mortgage that was taken out on this home.
Original Mortgage
$190,000
Interest Rate
3.84%
Mortgage Type
New Conventional
Purchase Details
Closed on
Dec 28, 1995
Sold by
Zwicker Walterr and Zwicker Donagene A
Bought by
Asack Louis G
Create a Home Valuation Report for This Property
The Home Valuation Report is an in-depth analysis detailing your home's value as well as a comparison with similar homes in the area
Home Values in the Area
Average Home Value in this Area
Purchase History
| Date | Buyer | Sale Price | Title Company |
|---|---|---|---|
| Asack Marta K | -- | None Available | |
| Asack Marta K | -- | None Available | |
| Mmag 2 Llc | -- | None Available | |
| Louis 3Rd G A | -- | -- | |
| Louis 3Rd G A | -- | -- | |
| Asack Louis G | $110,000 | -- | |
| Louis 3Rd G A | -- | -- | |
| Asack Louis G | $110,000 | -- |
Source: Public Records
Mortgage History
| Date | Status | Borrower | Loan Amount |
|---|---|---|---|
| Open | Asack Marta K | $167,000 | |
| Previous Owner | Asack Louis G | $190,000 | |
| Previous Owner | Asack Louis G | $447,000 |
Source: Public Records
Tax History Compared to Growth
Tax History
| Year | Tax Paid | Tax Assessment Tax Assessment Total Assessment is a certain percentage of the fair market value that is determined by local assessors to be the total taxable value of land and additions on the property. | Land | Improvement |
|---|---|---|---|---|
| 2025 | $5,251 | $433,600 | $138,300 | $295,300 |
| 2024 | $5,184 | $431,300 | $138,300 | $293,000 |
| 2023 | $5,284 | $407,100 | $103,100 | $304,000 |
| 2022 | $4,662 | $333,700 | $93,600 | $240,100 |
| 2021 | $4,492 | $309,800 | $77,500 | $232,300 |
| 2020 | $4,671 | $308,300 | $72,900 | $235,400 |
| 2019 | $4,446 | $286,100 | $70,800 | $215,300 |
| 2018 | $5,741 | $242,600 | $70,800 | $171,800 |
| 2017 | $3,951 | $245,400 | $70,800 | $174,600 |
| 2016 | $3,725 | $214,600 | $68,600 | $146,000 |
| 2015 | $3,630 | $200,000 | $68,600 | $131,400 |
| 2014 | $3,546 | $195,600 | $68,600 | $127,000 |
Source: Public Records
Map
Nearby Homes