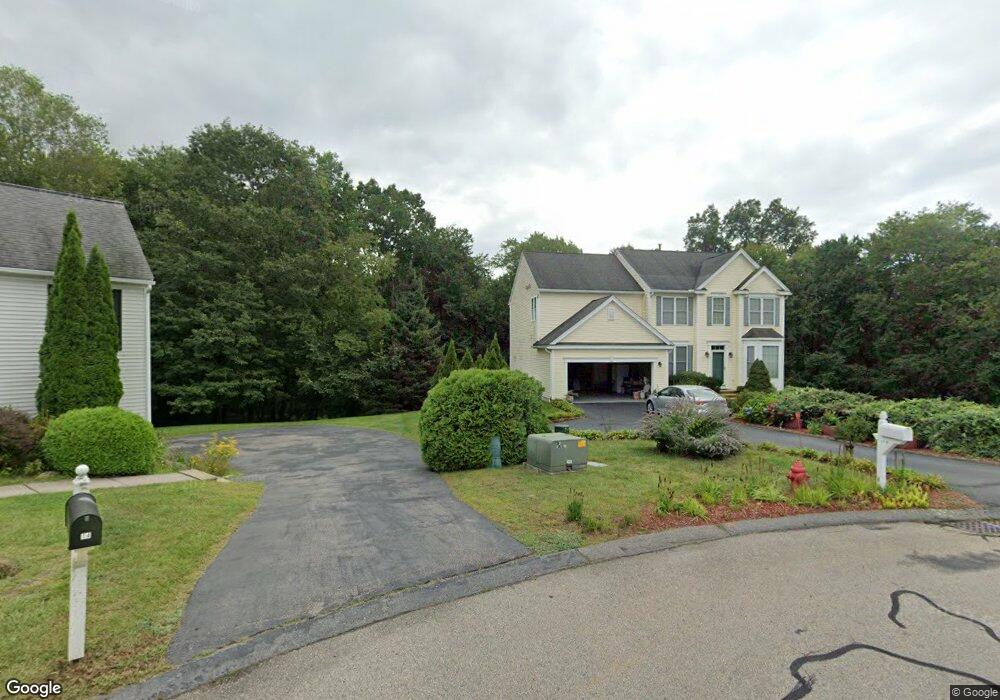
15 Aldrich Way Ashland, MA 01721
Estimated Value: $956,227 - $1,100,000
4
Beds
3
Baths
2,354
Sq Ft
$435/Sq Ft
Est. Value
About This Home
This home is located at 15 Aldrich Way, Ashland, MA 01721 and is currently estimated at $1,023,307, approximately $434 per square foot. 15 Aldrich Way is a home located in Middlesex County with nearby schools including William Pittaway Elementary School, David Mindess Elementary School, and Henry E. Warren Elementary School.
Ownership History
Date
Name
Owned For
Owner Type
Purchase Details
Closed on
Mar 31, 2025
Sold by
Traiforos Zoi
Bought by
15 Aldrich Way Rt and Traiforos
Current Estimated Value
Purchase Details
Closed on
Jan 20, 2000
Sold by
Pulte Home Corp Ne
Bought by
Traiforos Zoi
Home Financials for this Owner
Home Financials are based on the most recent Mortgage that was taken out on this home.
Original Mortgage
$276,300
Interest Rate
7.84%
Mortgage Type
Purchase Money Mortgage
Create a Home Valuation Report for This Property
The Home Valuation Report is an in-depth analysis detailing your home's value as well as a comparison with similar homes in the area
Home Values in the Area
Average Home Value in this Area
Purchase History
| Date | Buyer | Sale Price | Title Company |
|---|---|---|---|
| 15 Aldrich Way Rt | -- | None Available | |
| Traiforos Zoi | $352,043 | -- |
Source: Public Records
Mortgage History
| Date | Status | Borrower | Loan Amount |
|---|---|---|---|
| Previous Owner | Traiforos Zoi | $276,300 |
Source: Public Records
Tax History Compared to Growth
Tax History
| Year | Tax Paid | Tax Assessment Tax Assessment Total Assessment is a certain percentage of the fair market value that is determined by local assessors to be the total taxable value of land and additions on the property. | Land | Improvement |
|---|---|---|---|---|
| 2025 | $10,916 | $854,800 | $272,800 | $582,000 |
| 2024 | $10,434 | $788,100 | $272,800 | $515,300 |
| 2023 | $9,474 | $688,000 | $260,300 | $427,700 |
| 2022 | $9,592 | $604,000 | $236,600 | $367,400 |
| 2021 | $21 | $576,800 | $236,600 | $340,200 |
| 2020 | $8,949 | $553,800 | $240,400 | $313,400 |
| 2019 | $18,565 | $535,500 | $240,400 | $295,100 |
| 2018 | $8,650 | $520,800 | $238,400 | $282,400 |
| 2017 | $8,474 | $507,400 | $238,400 | $269,000 |
| 2016 | $8,294 | $487,900 | $238,400 | $249,500 |
| 2015 | $8,160 | $471,700 | $225,100 | $246,600 |
| 2014 | $7,815 | $449,400 | $210,000 | $239,400 |
Source: Public Records
Map
Nearby Homes