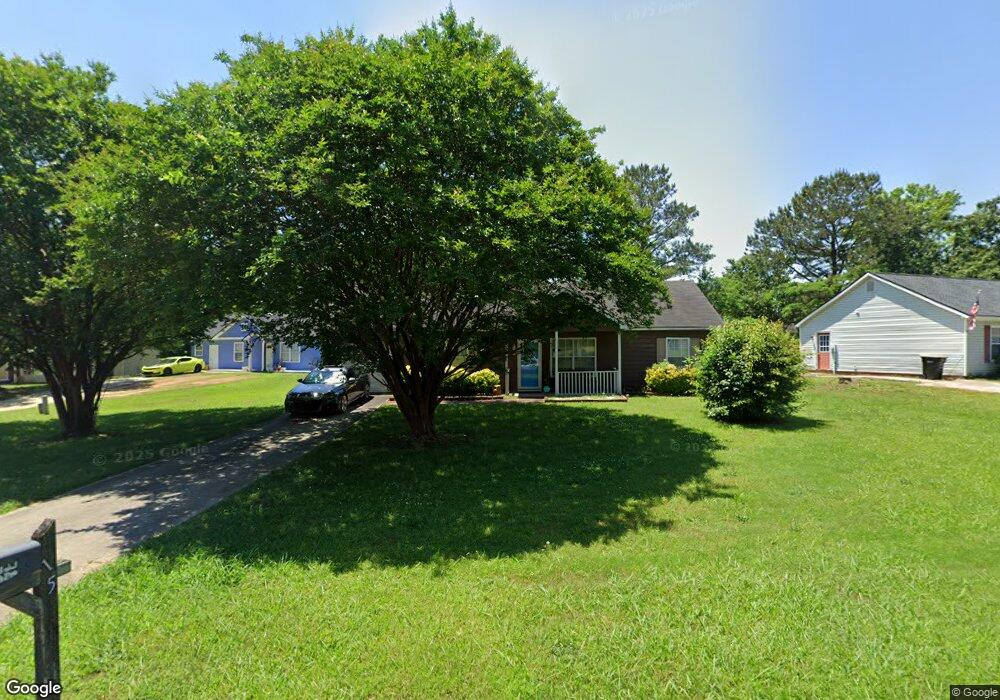
15 Alejo Ct Newnan, GA 30263
Estimated Value: $213,410 - $244,000
3
Beds
2
Baths
1,190
Sq Ft
$193/Sq Ft
Est. Value
About This Home
This home is located at 15 Alejo Ct, Newnan, GA 30263 and is currently estimated at $229,353, approximately $192 per square foot. 15 Alejo Ct is a home located in Coweta County with nearby schools including Jefferson Parkway Elementary School, Evans Middle School, and Newnan High School.
Ownership History
Date
Name
Owned For
Owner Type
Purchase Details
Closed on
Feb 13, 2008
Sold by
Pinto Daniel E
Bought by
Byrd Kevin
Current Estimated Value
Home Financials for this Owner
Home Financials are based on the most recent Mortgage that was taken out on this home.
Original Mortgage
$103,377
Outstanding Balance
$63,133
Interest Rate
5.46%
Mortgage Type
FHA
Estimated Equity
$166,220
Purchase Details
Closed on
Jan 13, 2006
Sold by
Byrd Kelvin
Bought by
Pinto Daniel E
Home Financials for this Owner
Home Financials are based on the most recent Mortgage that was taken out on this home.
Original Mortgage
$92,000
Interest Rate
7.38%
Mortgage Type
New Conventional
Purchase Details
Closed on
Nov 20, 1995
Sold by
Kyvest Ltd
Bought by
Byrd Kevin
Purchase Details
Closed on
May 27, 1994
Bought by
Kyvest Ltd
Purchase Details
Closed on
Apr 17, 1993
Bought by
Equitech Group Inc
Purchase Details
Closed on
Dec 26, 1986
Bought by
Katz Joe
Create a Home Valuation Report for This Property
The Home Valuation Report is an in-depth analysis detailing your home's value as well as a comparison with similar homes in the area
Home Values in the Area
Average Home Value in this Area
Purchase History
| Date | Buyer | Sale Price | Title Company |
|---|---|---|---|
| Byrd Kevin | $105,000 | -- | |
| Pinto Daniel E | $115,000 | -- | |
| Byrd Kevin | $66,000 | -- | |
| Kyvest Ltd | $654,000 | -- | |
| Equitech Group Inc | $180,000 | -- | |
| Katz Joe | $120,000 | -- |
Source: Public Records
Mortgage History
| Date | Status | Borrower | Loan Amount |
|---|---|---|---|
| Open | Byrd Kevin | $103,377 | |
| Previous Owner | Pinto Daniel E | $92,000 | |
| Closed | Byrd Kevin | $0 |
Source: Public Records
Tax History Compared to Growth
Tax History
| Year | Tax Paid | Tax Assessment Tax Assessment Total Assessment is a certain percentage of the fair market value that is determined by local assessors to be the total taxable value of land and additions on the property. | Land | Improvement |
|---|---|---|---|---|
| 2024 | $1,513 | $66,233 | $16,000 | $50,233 |
| 2023 | $1,513 | $60,565 | $16,000 | $44,565 |
| 2022 | $1,423 | $58,470 | $16,000 | $42,470 |
| 2021 | $721 | $41,857 | $8,000 | $33,857 |
| 2020 | $739 | $41,857 | $8,000 | $33,857 |
| 2019 | $554 | $33,302 | $4,000 | $29,302 |
| 2018 | $558 | $33,302 | $4,000 | $29,302 |
| 2017 | $530 | $32,489 | $4,000 | $28,489 |
| 2016 | $328 | $25,706 | $4,000 | $21,706 |
| 2015 | $329 | $25,706 | $4,000 | $21,706 |
| 2014 | $121 | $16,210 | $4,000 | $12,210 |
Source: Public Records
Map
Nearby Homes