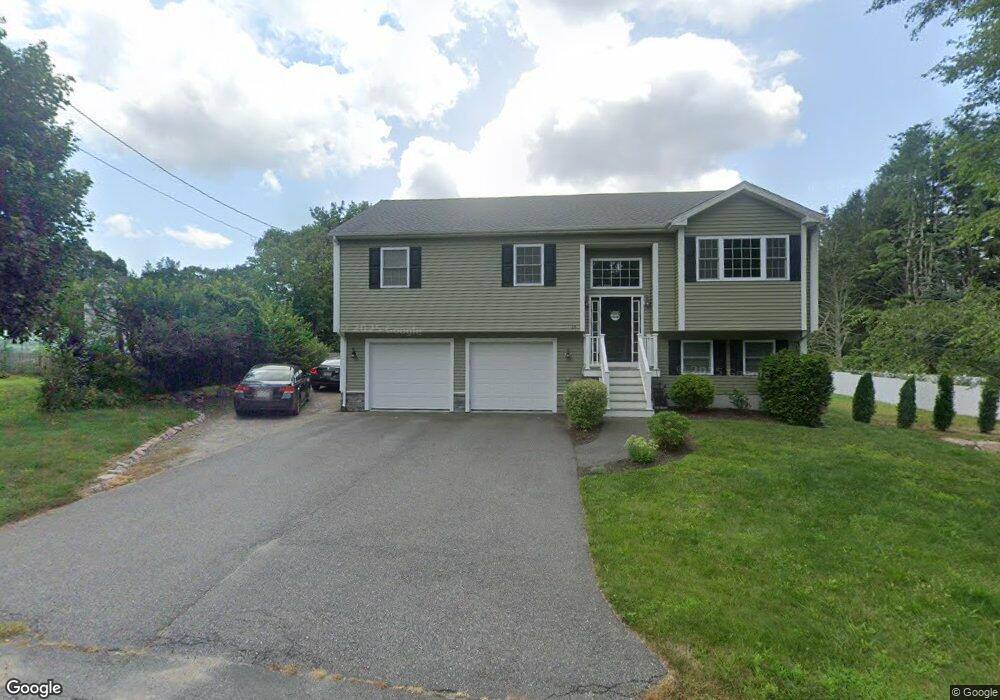
15 Allen St Acushnet, MA 02743
Upper Acushnet NeighborhoodEstimated Value: $508,000 - $681,000
--
Bed
1
Bath
1,470
Sq Ft
$386/Sq Ft
Est. Value
About This Home
This home is located at 15 Allen St, Acushnet, MA 02743 and is currently estimated at $568,103, approximately $386 per square foot. 15 Allen St is a home with nearby schools including Acushnet Elementary School, Albert F Ford Middle School, and Alma Del Mar Charter School.
Ownership History
Date
Name
Owned For
Owner Type
Purchase Details
Closed on
Aug 7, 2015
Sold by
Rose Philip M and Rose Debra A
Bought by
Calheta Kimberly A and Calheta Derek J
Current Estimated Value
Home Financials for this Owner
Home Financials are based on the most recent Mortgage that was taken out on this home.
Original Mortgage
$304,000
Outstanding Balance
$237,785
Interest Rate
4.03%
Mortgage Type
New Conventional
Estimated Equity
$330,318
Create a Home Valuation Report for This Property
The Home Valuation Report is an in-depth analysis detailing your home's value as well as a comparison with similar homes in the area
Home Values in the Area
Average Home Value in this Area
Purchase History
| Date | Buyer | Sale Price | Title Company |
|---|---|---|---|
| Calheta Kimberly A | $320,000 | -- |
Source: Public Records
Mortgage History
| Date | Status | Borrower | Loan Amount |
|---|---|---|---|
| Open | Calheta Kimberly A | $304,000 |
Source: Public Records
Tax History Compared to Growth
Tax History
| Year | Tax Paid | Tax Assessment Tax Assessment Total Assessment is a certain percentage of the fair market value that is determined by local assessors to be the total taxable value of land and additions on the property. | Land | Improvement |
|---|---|---|---|---|
| 2025 | $56 | $521,200 | $127,300 | $393,900 |
| 2024 | $5,599 | $490,700 | $120,600 | $370,100 |
| 2023 | $5,260 | $438,300 | $109,400 | $328,900 |
| 2022 | $4,812 | $362,600 | $102,700 | $259,900 |
| 2021 | $4,799 | $347,000 | $102,700 | $244,300 |
| 2020 | $4,744 | $340,300 | $96,000 | $244,300 |
| 2019 | $4,712 | $332,300 | $91,500 | $240,800 |
| 2018 | $4,571 | $317,000 | $91,500 | $225,500 |
| 2017 | $4,371 | $302,700 | $91,500 | $211,200 |
| 2016 | $1,329 | $91,500 | $91,500 | $0 |
| 2015 | -- | $91,500 | $91,500 | $0 |
Source: Public Records
Map
Nearby Homes