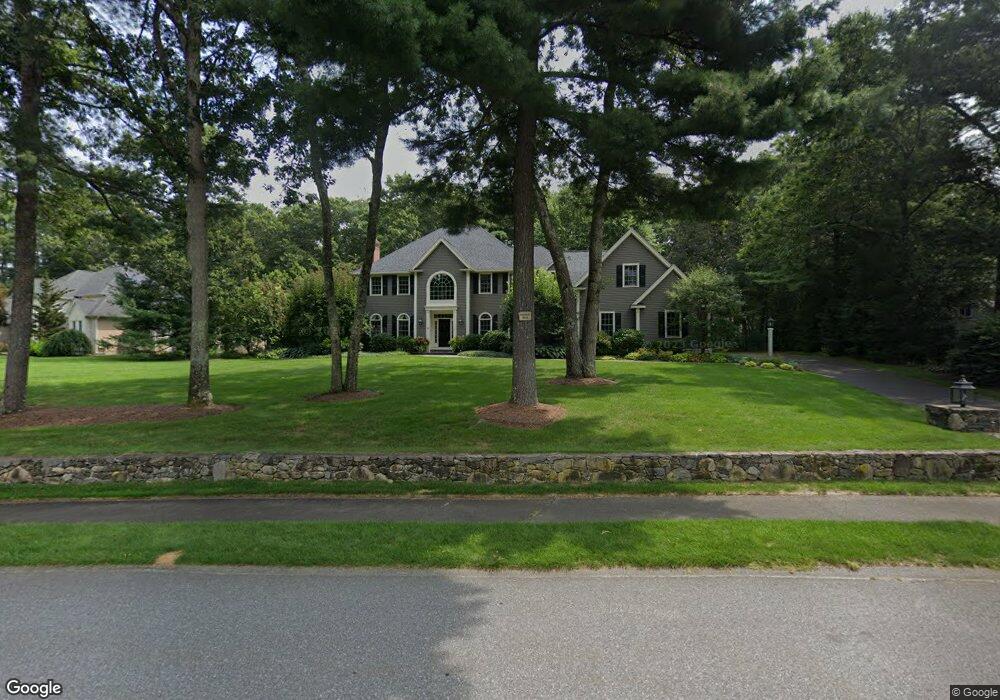
15 Amanda Rd Sudbury, MA 01776
Estimated Value: $1,630,451 - $1,966,000
5
Beds
4
Baths
3,785
Sq Ft
$470/Sq Ft
Est. Value
About This Home
This home is located at 15 Amanda Rd, Sudbury, MA 01776 and is currently estimated at $1,777,613, approximately $469 per square foot. 15 Amanda Rd is a home located in Middlesex County with nearby schools including Peter Noyes Elementary School, Ephraim Curtis Middle School, and Lincoln-Sudbury Regional High School.
Ownership History
Date
Name
Owned For
Owner Type
Purchase Details
Closed on
Aug 19, 1996
Sold by
Maillet & Son Inc
Bought by
Fitzhugh Robert J and Fitzhugh Mary
Current Estimated Value
Home Financials for this Owner
Home Financials are based on the most recent Mortgage that was taken out on this home.
Original Mortgage
$551,200
Outstanding Balance
$43,069
Interest Rate
8.08%
Mortgage Type
Purchase Money Mortgage
Estimated Equity
$1,734,544
Create a Home Valuation Report for This Property
The Home Valuation Report is an in-depth analysis detailing your home's value as well as a comparison with similar homes in the area
Home Values in the Area
Average Home Value in this Area
Purchase History
| Date | Buyer | Sale Price | Title Company |
|---|---|---|---|
| Fitzhugh Robert J | $689,000 | -- |
Source: Public Records
Mortgage History
| Date | Status | Borrower | Loan Amount |
|---|---|---|---|
| Open | Fitzhugh Robert J | $234,282 | |
| Open | Fitzhugh Robert J | $551,200 |
Source: Public Records
Tax History
| Year | Tax Paid | Tax Assessment Tax Assessment Total Assessment is a certain percentage of the fair market value that is determined by local assessors to be the total taxable value of land and additions on the property. | Land | Improvement |
|---|---|---|---|---|
| 2025 | $24,551 | $1,677,000 | $625,800 | $1,051,200 |
| 2024 | $23,614 | $1,616,300 | $607,800 | $1,008,500 |
| 2023 | $22,247 | $1,410,700 | $568,200 | $842,500 |
| 2022 | $20,871 | $1,156,300 | $481,400 | $674,900 |
| 2021 | $20,031 | $1,063,800 | $481,400 | $582,400 |
| 2020 | $20,122 | $1,090,600 | $508,200 | $582,400 |
| 2019 | $19,533 | $1,090,600 | $508,200 | $582,400 |
| 2018 | $18,859 | $1,051,800 | $521,400 | $530,400 |
| 2017 | $17,928 | $1,010,600 | $485,400 | $525,200 |
| 2016 | $17,376 | $976,200 | $466,600 | $509,600 |
| 2015 | $16,836 | $956,600 | $457,400 | $499,200 |
| 2014 | $16,824 | $933,100 | $444,200 | $488,900 |
Source: Public Records
Map
Nearby Homes
- 30 Kendall Rd
- 53 Pine St
- 30 Rolling Ln
- 557 Dutton Rd Unit 2
- 0 Robbins Rd
- 0 Boston Post Rd
- 123 Dutton Rd
- 725 Boston Post Rd Unit 12
- 11 Great Lake Dr
- 15 Harness Ln
- 62 Churchill St
- 30 Harness Ln
- 11 October Rd
- 11 Farmstead Ln Unit 11
- 22 Barracks Rd Unit 22
- 24 Woodland Rd
- 45 Webster Cir
- 1011 Boston Post Rd
- 62 Hawkins Ln
- 788 Main St
Your Personal Tour Guide
Ask me questions while you tour the home.