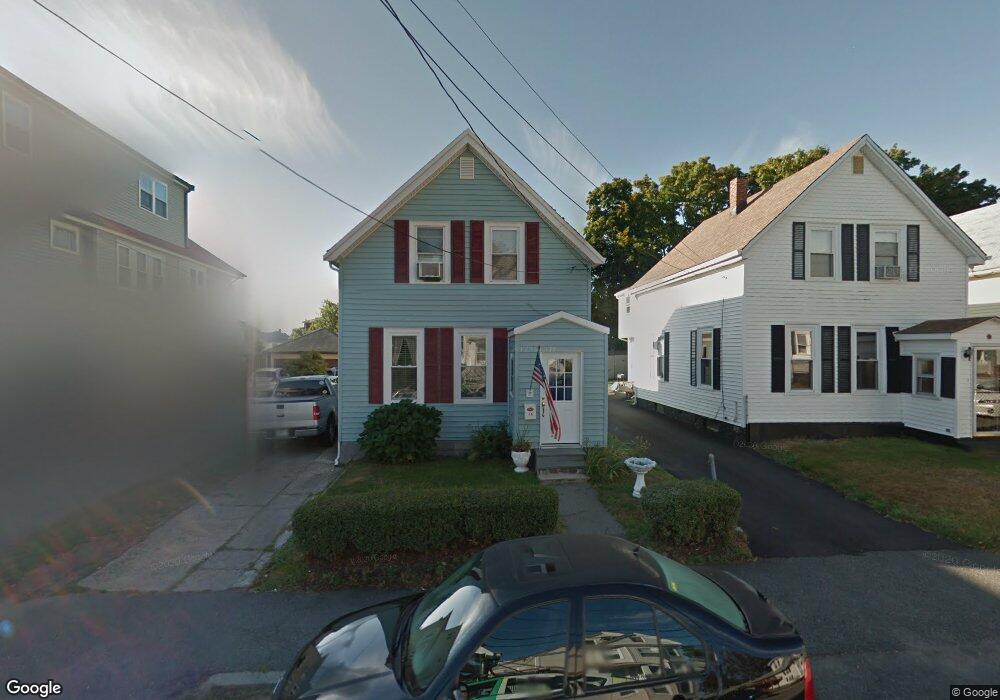
15 Appleton St Quincy, MA 02171
North Quincy NeighborhoodEstimated Value: $719,301 - $781,000
3
Beds
3
Baths
1,350
Sq Ft
$562/Sq Ft
Est. Value
About This Home
This home is located at 15 Appleton St, Quincy, MA 02171 and is currently estimated at $758,075, approximately $561 per square foot. 15 Appleton St is a home located in Norfolk County with nearby schools including Francis W. Parker Elementary School, Atlantic Middle School, and North Quincy High School.
Ownership History
Date
Name
Owned For
Owner Type
Purchase Details
Closed on
Oct 31, 1988
Sold by
Pierce Beverly A
Bought by
Holcomb James A
Current Estimated Value
Create a Home Valuation Report for This Property
The Home Valuation Report is an in-depth analysis detailing your home's value as well as a comparison with similar homes in the area
Home Values in the Area
Average Home Value in this Area
Purchase History
| Date | Buyer | Sale Price | Title Company |
|---|---|---|---|
| Holcomb James A | $139,900 | -- |
Source: Public Records
Mortgage History
| Date | Status | Borrower | Loan Amount |
|---|---|---|---|
| Open | Holcomb James A | $185,500 | |
| Closed | Holcomb James A | $134,250 | |
| Closed | Holcomb James A | $13,000 |
Source: Public Records
Tax History Compared to Growth
Tax History
| Year | Tax Paid | Tax Assessment Tax Assessment Total Assessment is a certain percentage of the fair market value that is determined by local assessors to be the total taxable value of land and additions on the property. | Land | Improvement |
|---|---|---|---|---|
| 2025 | $7,181 | $622,800 | $347,500 | $275,300 |
| 2024 | $6,902 | $612,400 | $347,500 | $264,900 |
| 2023 | $6,362 | $566,900 | $315,900 | $251,000 |
| 2022 | $5,997 | $500,600 | $252,700 | $247,900 |
| 2021 | $5,737 | $472,600 | $252,700 | $219,900 |
| 2020 | $5,612 | $451,500 | $247,700 | $203,800 |
| 2019 | $5,502 | $438,400 | $238,200 | $200,200 |
| 2018 | $5,441 | $407,900 | $226,900 | $181,000 |
| 2017 | $5,304 | $374,300 | $206,200 | $168,100 |
| 2016 | $4,944 | $344,300 | $187,500 | $156,800 |
| 2015 | $4,608 | $315,600 | $170,500 | $145,100 |
| 2014 | $4,471 | $300,900 | $170,500 | $130,400 |
Source: Public Records
Map
Nearby Homes
- 201 Billings St
- 58 Bayfield Rd S
- 297 Billings St
- 38 Walker St
- 25 Hummock Rd
- 85 E Squantum St Unit 10
- 175 Quincy Shore Dr Unit B24
- 6 Warwick St
- 212 Quincy Shore Dr
- 91 Atlantic St
- 148 Quincy Shore Dr Unit 43
- 138 Quincy Shore Dr Unit 170
- 68 Atlantic St
- 90 Shore Ave
- 90 Quincy Shore Dr Unit 701
- 90 Quincy Shore Dr Unit 501
- 166 Quincy Shore Dr Unit 108
- 133 Commander Shea Blvd Unit 315
- 133 Commander Shea Blvd Unit 609
- 133 Commander Shea Blvd Unit 620
- 11 Appleton St
- 19 Appleton St
- 19 Appleton St Unit 21
- 19 Appleton St Unit 1
- 9 Appleton St
- 22 Appleton St Unit 2
- 23 Appleton St
- 23 Appleton St Unit 2
- 27 Appleton St
- 10 Bayfield Rd Unit 5
- 10 Bayfield Rd Unit 4
- 10 Bayfield Rd Unit 3
- 10 Bayfield Rd Unit 2
- 10 Bayfield Rd Unit 1
- 195 E Squantum St
- 189 E Squantum St
- 00 Bayfield Rd S
- 10 Appleton St
- 10 Appleton St Unit 2
- 10 Appleton St Unit 1