15 Ardmore Rd Holland, MA 01521
Estimated Value: $279,000 - $386,000
2
Beds
1
Bath
1,224
Sq Ft
$272/Sq Ft
Est. Value
About This Home
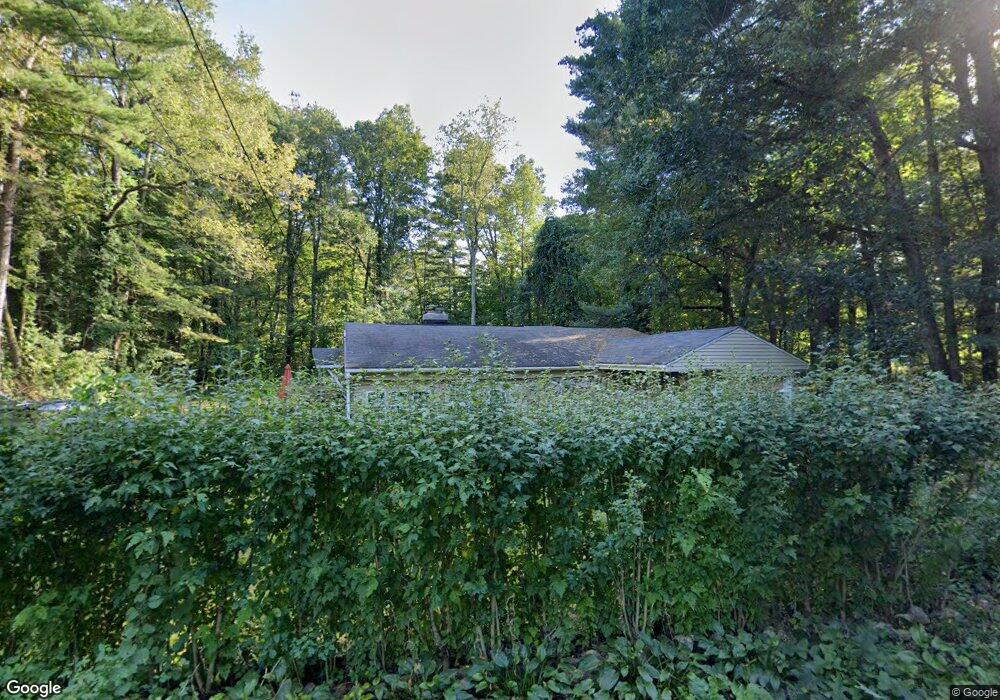
This home is located at 15 Ardmore Rd, Holland, MA 01521 and is currently estimated at $333,098, approximately $272 per square foot. 15 Ardmore Rd is a home located in Hampden County with nearby schools including Holland Elementary School, Tantasqua Regional Junior High School, and Tantasqua Regional High School.
Ownership History
Date
Name
Owned For
Owner Type
Purchase Details
Closed on
Dec 11, 2008
Sold by
Holland Town Of
Bought by
Harhay Andrew J and Harhay Lynn S
Current Estimated Value
Purchase Details
Closed on
May 16, 2008
Sold by
Vaudreuil Helen G and Gaudet George J
Bought by
Radoc Glorine C and Yankus Rosita C
Home Financials for this Owner
Home Financials are based on the most recent Mortgage that was taken out on this home.
Original Mortgage
$144,000
Interest Rate
5.91%
Mortgage Type
Purchase Money Mortgage
Create a Home Valuation Report for This Property
The Home Valuation Report is an in-depth analysis detailing your home's value as well as a comparison with similar homes in the area
Home Values in the Area
Average Home Value in this Area
Purchase History
| Date | Buyer | Sale Price | Title Company |
|---|---|---|---|
| Harhay Andrew J | -- | -- | |
| Radoc Glorine C | $159,000 | -- | |
| Radoc Glorine C | $159,000 | -- |
Source: Public Records
Mortgage History
| Date | Status | Borrower | Loan Amount |
|---|---|---|---|
| Previous Owner | Radoc Glorine C | $144,000 |
Source: Public Records
Tax History Compared to Growth
Tax History
| Year | Tax Paid | Tax Assessment Tax Assessment Total Assessment is a certain percentage of the fair market value that is determined by local assessors to be the total taxable value of land and additions on the property. | Land | Improvement |
|---|---|---|---|---|
| 2025 | $3,067 | $236,300 | $45,200 | $191,100 |
| 2024 | $2,974 | $219,500 | $45,200 | $174,300 |
| 2023 | $56 | $215,900 | $45,200 | $170,700 |
| 2022 | $2,536 | $163,200 | $40,300 | $122,900 |
| 2021 | $55 | $147,600 | $34,900 | $112,700 |
| 2020 | $55 | $146,400 | $34,900 | $111,500 |
| 2019 | $55 | $138,600 | $34,900 | $103,700 |
| 2018 | $49 | $134,600 | $30,900 | $103,700 |
| 2017 | $49 | $132,200 | $30,900 | $101,300 |
| 2016 | $2,177 | $135,400 | $32,900 | $102,500 |
| 2015 | $2,125 | $130,900 | $32,900 | $98,000 |
Source: Public Records
Map
Nearby Homes
- 10 Brandon St
- 60 Gilbronson Rd
- 26 Stony Hill Rd
- 21 Howard Rd
- 7 Sheila Dr
- 122 Vinton Rd
- 77 Vinton Rd
- 35 Island Rd
- 17 Vinton Rd
- 3 Sunset Ln
- 54 Mashapaug Rd
- 44 Mashapaug Rd
- 6 Kimball Hill Rd
- 99 Breakneck Rd
- 0 E Brimfield Rd
- 61 Bennetts Rd
- 88 Stafford Holland Rd
- 5 Old County Rd
- 198 Union Rd
- 894 Buckley Hwy