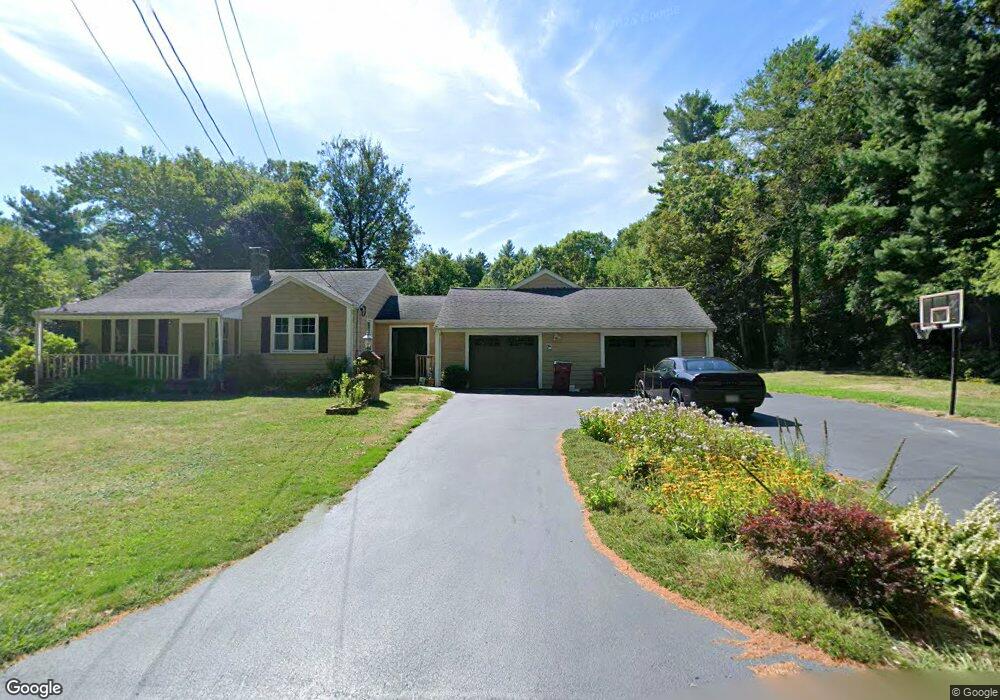
15 Ash St Middleboro, MA 02346
Estimated Value: $545,000 - $725,000
4
Beds
2
Baths
2,296
Sq Ft
$286/Sq Ft
Est. Value
About This Home
This home is located at 15 Ash St, Middleboro, MA 02346 and is currently estimated at $655,964, approximately $285 per square foot. 15 Ash St is a home located in Plymouth County with nearby schools including Mary K. Goode Elementary School and Chamberlain International School.
Ownership History
Date
Name
Owned For
Owner Type
Purchase Details
Closed on
Jun 1, 2006
Sold by
Teceno Dorothy M and Teceno Robert C
Bought by
Teceno Peter M and Teceno Jennie L
Current Estimated Value
Home Financials for this Owner
Home Financials are based on the most recent Mortgage that was taken out on this home.
Original Mortgage
$140,000
Interest Rate
6.55%
Mortgage Type
Purchase Money Mortgage
Create a Home Valuation Report for This Property
The Home Valuation Report is an in-depth analysis detailing your home's value as well as a comparison with similar homes in the area
Home Values in the Area
Average Home Value in this Area
Purchase History
| Date | Buyer | Sale Price | Title Company |
|---|---|---|---|
| Teceno Peter M | $200,000 | -- |
Source: Public Records
Mortgage History
| Date | Status | Borrower | Loan Amount |
|---|---|---|---|
| Open | Teceno Peter M | $140,250 | |
| Closed | Teceno Peter M | $140,000 | |
| Previous Owner | Teceno Peter M | $192,000 |
Source: Public Records
Tax History
| Year | Tax Paid | Tax Assessment Tax Assessment Total Assessment is a certain percentage of the fair market value that is determined by local assessors to be the total taxable value of land and additions on the property. | Land | Improvement |
|---|---|---|---|---|
| 2025 | $7,679 | $572,600 | $171,900 | $400,700 |
| 2024 | $7,394 | $546,100 | $163,900 | $382,200 |
| 2023 | $6,802 | $477,700 | $163,900 | $313,800 |
| 2022 | $6,472 | $420,800 | $142,300 | $278,500 |
| 2021 | $6,445 | $396,100 | $124,700 | $271,400 |
| 2020 | $6,219 | $391,600 | $124,700 | $266,900 |
| 2019 | $5,822 | $376,100 | $124,700 | $251,400 |
| 2018 | $5,398 | $346,000 | $118,500 | $227,500 |
| 2017 | $5,138 | $325,800 | $114,000 | $211,800 |
| 2016 | $5,225 | $328,200 | $107,900 | $220,300 |
| 2015 | $4,826 | $305,800 | $108,500 | $197,300 |
Source: Public Records
Map
Nearby Homes
- 218 Old Center St
- 50 Cross St
- 50 Cross St & 0 Cross (Rear)
- 246 Everett St
- 0 Murdock St Unit 73473837
- 23 Taunton St
- 23 Moulton St
- 15,17 & 21 Harding St Route 44
- 958 Centre St
- 132 Everett St
- 121 North St
- 0 Cross Street (Rear)
- 80 Forest St
- Off Vernon St
- 145 Wesley Cir
- 28 Haskell Cir
- 486 Richmond St
- 194 Bedford St
- 75 Oak St
- 12 Southwick St
Your Personal Tour Guide
Ask me questions while you tour the home.