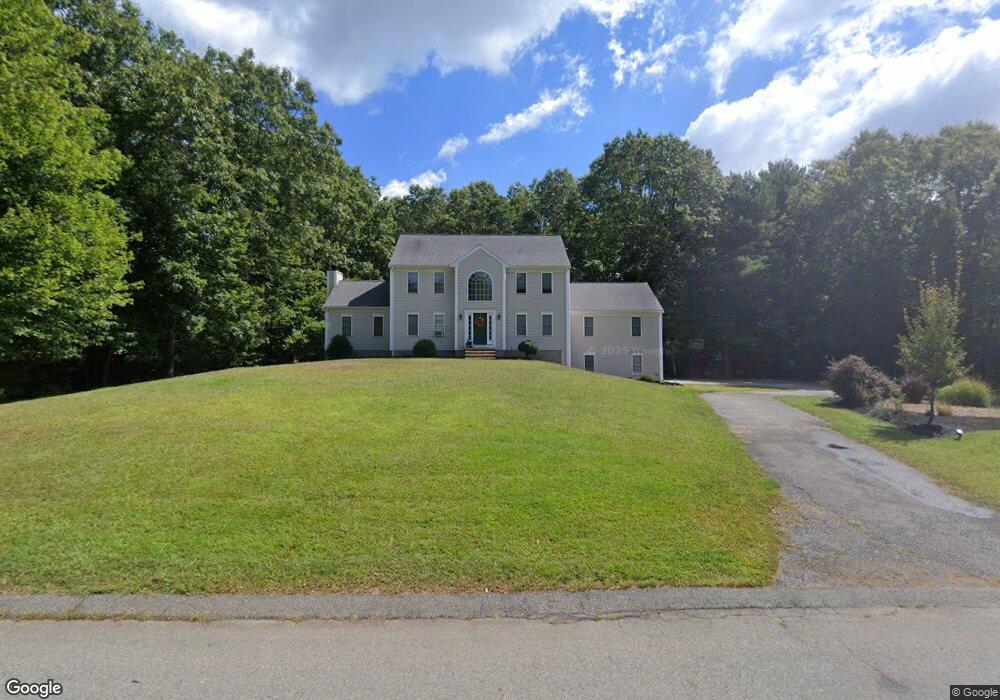
15 Azel Rd East Freetown, MA 02717
Estimated Value: $772,000 - $900,000
3
Beds
3
Baths
2,972
Sq Ft
$281/Sq Ft
Est. Value
About This Home
This home is located at 15 Azel Rd, East Freetown, MA 02717 and is currently estimated at $836,002, approximately $281 per square foot. 15 Azel Rd is a home located in Bristol County with nearby schools including Freetown Elementary School, George R Austin Intermediate School, and Freetown-Lakeville Middle School.
Ownership History
Date
Name
Owned For
Owner Type
Purchase Details
Closed on
Sep 15, 2000
Sold by
Bartlett Gene and Will Francis A
Bought by
Lino David and Lino Kimberly
Current Estimated Value
Home Financials for this Owner
Home Financials are based on the most recent Mortgage that was taken out on this home.
Original Mortgage
$200,000
Interest Rate
8.07%
Create a Home Valuation Report for This Property
The Home Valuation Report is an in-depth analysis detailing your home's value as well as a comparison with similar homes in the area
Home Values in the Area
Average Home Value in this Area
Purchase History
| Date | Buyer | Sale Price | Title Company |
|---|---|---|---|
| Lino David | $78,000 | -- |
Source: Public Records
Mortgage History
| Date | Status | Borrower | Loan Amount |
|---|---|---|---|
| Open | Lino David | $233,000 | |
| Closed | Lino David | $25,000 | |
| Closed | Lino David | $230,000 | |
| Closed | Lino David | $200,000 |
Source: Public Records
Tax History Compared to Growth
Tax History
| Year | Tax Paid | Tax Assessment Tax Assessment Total Assessment is a certain percentage of the fair market value that is determined by local assessors to be the total taxable value of land and additions on the property. | Land | Improvement |
|---|---|---|---|---|
| 2025 | $7,138 | $720,300 | $216,100 | $504,200 |
| 2024 | $7,090 | $679,800 | $203,800 | $476,000 |
| 2023 | $6,981 | $651,800 | $183,600 | $468,200 |
| 2022 | $6,708 | $556,200 | $155,500 | $400,700 |
| 2021 | $6,486 | $510,700 | $141,300 | $369,400 |
| 2020 | $6,540 | $502,300 | $135,900 | $366,400 |
| 2019 | $6,287 | $478,100 | $135,000 | $343,100 |
| 2018 | $5,931 | $445,600 | $135,000 | $310,600 |
| 2017 | $5,788 | $434,500 | $135,000 | $299,500 |
| 2016 | $5,568 | $425,400 | $131,100 | $294,300 |
| 2015 | $5,387 | $417,600 | $125,700 | $291,900 |
| 2014 | $5,231 | $414,800 | $128,500 | $286,300 |
Source: Public Records
Map
Nearby Homes