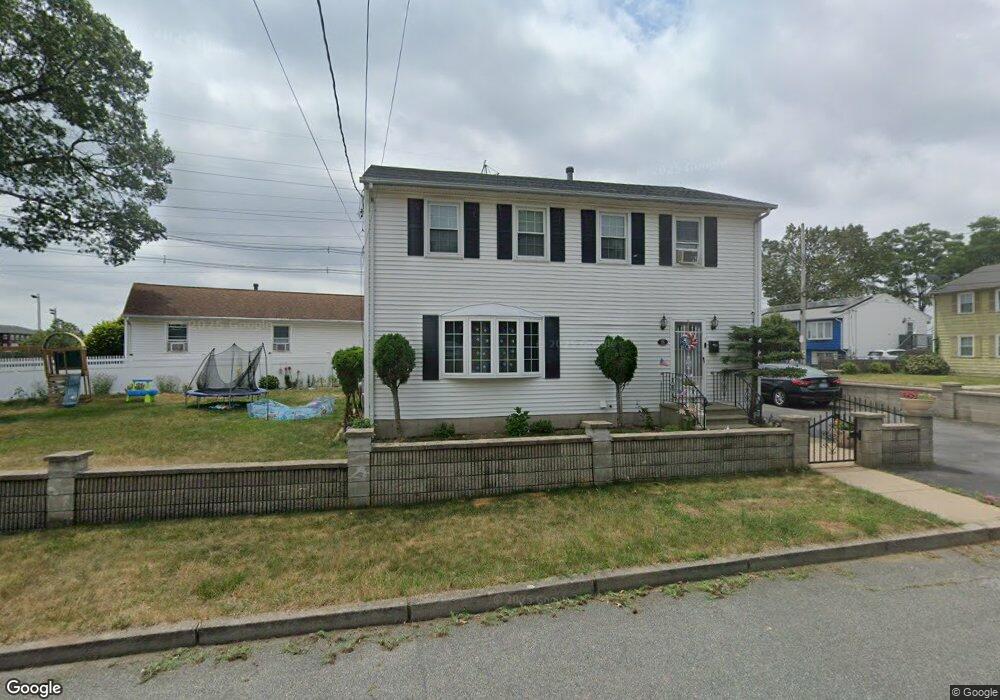
15 Balbo St Pawtucket, RI 02860
Beverage Hill-The Plains NeighborhoodEstimated Value: $377,000 - $487,000
4
Beds
2
Baths
2,068
Sq Ft
$214/Sq Ft
Est. Value
About This Home
This home is located at 15 Balbo St, Pawtucket, RI 02860 and is currently estimated at $442,564, approximately $214 per square foot. 15 Balbo St is a home located in Providence County with nearby schools including International Charter School, Blackstone Academy Charter School, and Saint Teresa Catholic Elementary School.
Ownership History
Date
Name
Owned For
Owner Type
Purchase Details
Closed on
Apr 30, 2003
Sold by
Dovale Octavio P and Dovale Fatima N
Bought by
Singh Shalendra K and Singh Pushpawati
Current Estimated Value
Home Financials for this Owner
Home Financials are based on the most recent Mortgage that was taken out on this home.
Original Mortgage
$165,000
Interest Rate
5.82%
Create a Home Valuation Report for This Property
The Home Valuation Report is an in-depth analysis detailing your home's value as well as a comparison with similar homes in the area
Home Values in the Area
Average Home Value in this Area
Purchase History
| Date | Buyer | Sale Price | Title Company |
|---|---|---|---|
| Singh Shalendra K | $210,000 | -- | |
| Singh Shalendra K | $210,000 | -- |
Source: Public Records
Mortgage History
| Date | Status | Borrower | Loan Amount |
|---|---|---|---|
| Open | Singh Shalendra K | $170,000 | |
| Closed | Singh Shalendra K | $185,600 | |
| Closed | Singh Shalendra K | $11,600 | |
| Closed | Singh Shalendra K | $165,000 |
Source: Public Records
Tax History Compared to Growth
Tax History
| Year | Tax Paid | Tax Assessment Tax Assessment Total Assessment is a certain percentage of the fair market value that is determined by local assessors to be the total taxable value of land and additions on the property. | Land | Improvement |
|---|---|---|---|---|
| 2025 | $4,695 | $357,000 | $128,400 | $228,600 |
| 2024 | $4,405 | $357,000 | $128,400 | $228,600 |
| 2023 | $4,957 | $292,600 | $78,100 | $214,500 |
| 2022 | $4,851 | $292,600 | $78,100 | $214,500 |
| 2021 | $4,851 | $292,600 | $78,100 | $214,500 |
| 2020 | $4,696 | $224,800 | $59,000 | $165,800 |
| 2019 | $4,696 | $224,800 | $59,000 | $165,800 |
| 2018 | $4,525 | $224,800 | $59,000 | $165,800 |
| 2017 | $4,817 | $212,000 | $46,100 | $165,900 |
| 2016 | $4,641 | $212,000 | $46,100 | $165,900 |
| 2015 | $4,641 | $212,000 | $46,100 | $165,900 |
| 2014 | $4,663 | $202,200 | $46,100 | $156,100 |
Source: Public Records
Map
Nearby Homes