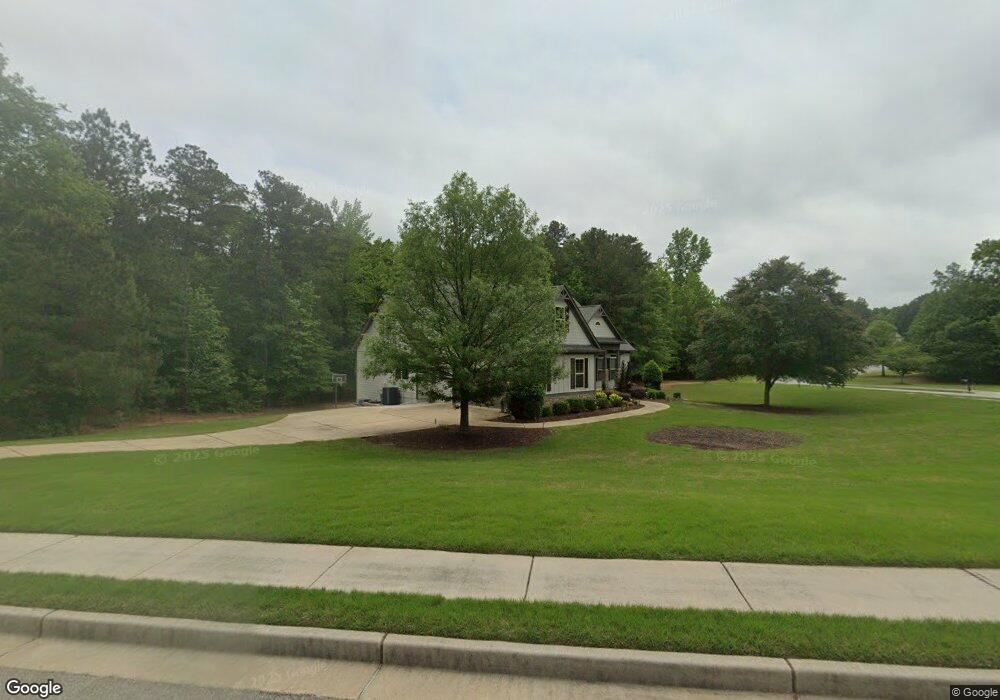
15 Baylaurel Dr Sharpsburg, GA 30277
Estimated Value: $717,600 - $777,000
4
Beds
4
Baths
4,765
Sq Ft
$159/Sq Ft
Est. Value
About This Home
This home is located at 15 Baylaurel Dr, Sharpsburg, GA 30277 and is currently estimated at $759,650, approximately $159 per square foot. 15 Baylaurel Dr is a home located in Coweta County with nearby schools including Canongate Elementary School, Madras Middle School, and Northgate High School.
Ownership History
Date
Name
Owned For
Owner Type
Purchase Details
Closed on
Jul 15, 2011
Sold by
Mansfield Homes Llc
Bought by
Whaley Brady and Whaley Mary H
Current Estimated Value
Purchase Details
Closed on
Mar 7, 2011
Sold by
Wild Turkey 3 Llc
Bought by
Mansfield Homes Llc
Purchase Details
Closed on
Jan 28, 2011
Sold by
Brent Coweta Llc
Bought by
Wild Turkey 3 Llc
Purchase Details
Closed on
Apr 23, 2009
Sold by
Crm Central Properties Llc
Bought by
Brent Coweta Llc
Purchase Details
Closed on
Apr 2, 2009
Sold by
Beta Construction Inc
Bought by
Crm Central Properties Llc
Purchase Details
Closed on
Jan 3, 2007
Sold by
D Brent Llc
Bought by
Beta Construction Inc
Purchase Details
Closed on
Sep 25, 2003
Sold by
Killearn Inc
Bought by
D Brent Llc
Purchase Details
Closed on
Jan 5, 1998
Bought by
Killearn Inc
Create a Home Valuation Report for This Property
The Home Valuation Report is an in-depth analysis detailing your home's value as well as a comparison with similar homes in the area
Home Values in the Area
Average Home Value in this Area
Purchase History
| Date | Buyer | Sale Price | Title Company |
|---|---|---|---|
| Whaley Brady | $409,500 | -- | |
| Mansfield Homes Llc | $32,500 | -- | |
| Wild Turkey 3 Llc | $65,000 | -- | |
| Brent Coweta Llc | $1,081,000 | -- | |
| Crm Central Properties Llc | -- | -- | |
| Beta Construction Inc | $2,240,000 | -- | |
| D Brent Llc | $5,000,000 | -- | |
| Killearn Inc | $4,237,000 | -- |
Source: Public Records
Tax History Compared to Growth
Tax History
| Year | Tax Paid | Tax Assessment Tax Assessment Total Assessment is a certain percentage of the fair market value that is determined by local assessors to be the total taxable value of land and additions on the property. | Land | Improvement |
|---|---|---|---|---|
| 2025 | $5,713 | $283,492 | $36,000 | $247,492 |
| 2024 | $5,643 | $286,192 | $36,000 | $250,192 |
| 2023 | $5,643 | $256,159 | $32,000 | $224,159 |
| 2022 | $4,967 | $243,987 | $32,000 | $211,987 |
| 2021 | $3,904 | $190,723 | $24,000 | $166,723 |
| 2020 | $4,929 | $190,723 | $24,000 | $166,723 |
| 2019 | $5,718 | $200,144 | $24,000 | $176,144 |
| 2018 | $5,728 | $200,144 | $24,000 | $176,144 |
| 2017 | $5,643 | $192,541 | $24,000 | $168,541 |
| 2016 | $5,209 | $179,868 | $24,000 | $155,868 |
| 2015 | $4,868 | $170,998 | $24,000 | $146,998 |
| 2014 | $4,578 | $162,128 | $24,000 | $138,128 |
Source: Public Records
Map
Nearby Homes
- 9 Warrior Way
- 40 Joe Lee Dr
- 35 Palmer Place
- 78 Rosebay Ln
- 30 Joe Lee Dr
- 575 Laurelwood Dr
- 110 Kylemore Pass
- 200 Chaparral Trace
- 500 Laurelwood Dr
- 291 Cannongate Rd
- 150 Kylemore Pass
- 32 Riverbirch Way
- 20 Skipton Ct
- 104 Ashland Trail
- 140 Palmetto Pines Rd
- 100 Ashland Trail
- 100 Clydesdale Ct
- 518 Palmetto Tyrone Rd
- 56 Hudgen Rd
- 70 N Strathmore Dr
- 128 Willow Leaf
- 152 Willowleaf Way
- 35 Baylaurel Dr
- 170 Willowleaf Way
- 116 Willowleaf Way
- 180 Willow Leaf Way
- 180 Willowleaf Way
- 71 Baylaurel Dr
- 194 Willowleaf Way
- 194 Willowleaf Way Unit LOT 211
- 194 Willow Leaf Way Unit LOT 211
- 201 Willow Leaf Way
- 201 Willowleaf Way
- 60 Yellowwood Dr
- 96 Yellowwood Dr
- 102 Yellowwood Dr
- 81 Baylaurel Dr
- 0 Baylaurel Dr Unit LOT 136 3167662
- 0 Baylaurel Dr Unit 3090003
- 0 Baylaurel Dr Unit 3200651