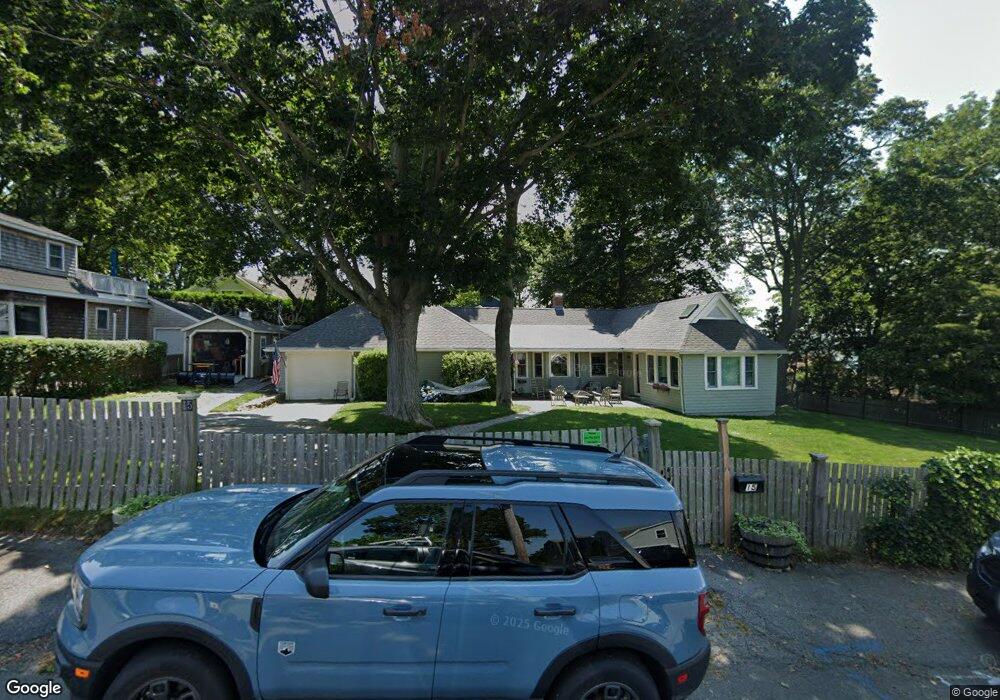
15 Bayview Rd Marblehead, MA 01945
Estimated Value: $1,148,995 - $1,198,000
3
Beds
2
Baths
1,848
Sq Ft
$635/Sq Ft
Est. Value
About This Home
This home is located at 15 Bayview Rd, Marblehead, MA 01945 and is currently estimated at $1,173,249, approximately $634 per square foot. 15 Bayview Rd is a home located in Essex County with nearby schools including Marblehead High School, Marblehead Community Charter Public School, and Tower School.
Ownership History
Date
Name
Owned For
Owner Type
Purchase Details
Closed on
Apr 15, 2005
Sold by
Plotka Jean E
Bought by
Freiberger Philip W and Mccarthy-Freiberger Erin
Current Estimated Value
Purchase Details
Closed on
Apr 17, 1998
Sold by
Jackson Robert F
Bought by
Plotka Jean E
Purchase Details
Closed on
Jan 8, 1997
Sold by
Shea Mildred Est
Bought by
Jackson Robert F
Create a Home Valuation Report for This Property
The Home Valuation Report is an in-depth analysis detailing your home's value as well as a comparison with similar homes in the area
Home Values in the Area
Average Home Value in this Area
Purchase History
| Date | Buyer | Sale Price | Title Company |
|---|---|---|---|
| Freiberger Philip W | $599,500 | -- | |
| Freiberger Philip W | $599,500 | -- | |
| Plotka Jean E | $320,000 | -- | |
| Plotka Jean E | $320,000 | -- | |
| Jackson Robert F | $142,100 | -- | |
| Jackson Robert F | $142,100 | -- |
Source: Public Records
Mortgage History
| Date | Status | Borrower | Loan Amount |
|---|---|---|---|
| Closed | Jackson Robert F | $150,000 | |
| Closed | Jackson Robert F | $150,000 |
Source: Public Records
Tax History
| Year | Tax Paid | Tax Assessment Tax Assessment Total Assessment is a certain percentage of the fair market value that is determined by local assessors to be the total taxable value of land and additions on the property. | Land | Improvement |
|---|---|---|---|---|
| 2025 | $9,021 | $996,800 | $576,500 | $420,300 |
| 2024 | $8,133 | $907,700 | $619,700 | $288,000 |
| 2023 | $8,042 | $804,200 | $540,500 | $263,700 |
| 2022 | $7,892 | $750,200 | $475,600 | $274,600 |
| 2021 | $7,724 | $741,300 | $461,200 | $280,100 |
| 2020 | $6,379 | $614,000 | $446,800 | $167,200 |
| 2019 | $6,284 | $585,100 | $417,900 | $167,200 |
| 2018 | $6,289 | $570,700 | $403,500 | $167,200 |
| 2017 | $5,808 | $527,500 | $360,300 | $167,200 |
| 2016 | $5,603 | $504,800 | $331,500 | $173,300 |
| 2015 | $5,470 | $493,700 | $317,100 | $176,600 |
| 2014 | $4,948 | $446,200 | $273,800 | $172,400 |
Source: Public Records
Map
Nearby Homes
- 1 Knollwood Rd
- 100 Village St
- 70 Maverick St
- 55 Pitman Rd
- 6 Mount Vernon St
- 27 Village St Unit 1
- 290 Washington St Unit 1
- 290 Washington St Unit A
- 89 Naugus Ave
- 9 Glover St Unit 1
- 132 Elm St
- 132 Elm St Unit 132
- 29 Ocean Ave Unit 4
- 66 Pleasant St Unit 1
- 66 Pleasant St Unit 2
- 2 Beacon Hill Rd
- 282 Pleasant St
- 59 Leach St Unit 2
- 4 Willow Ave Unit 2
- 45 Pleasant St