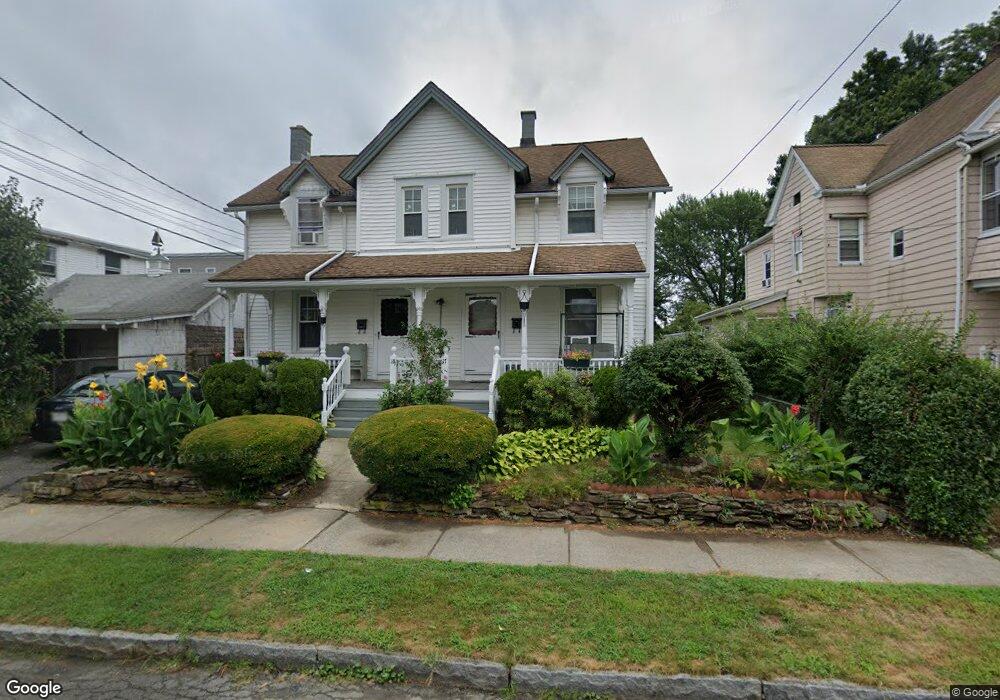
15 Bell St Chicopee, MA 01013
Chicopee Center NeighborhoodEstimated Value: $302,898 - $432,000
5
Beds
3
Baths
2,212
Sq Ft
$165/Sq Ft
Est. Value
About This Home
This home is located at 15 Bell St, Chicopee, MA 01013 and is currently estimated at $364,225, approximately $164 per square foot. 15 Bell St is a home located in Hampden County with nearby schools including Bowe Elementary School, Fairview Middle School, and Chicopee High School.
Ownership History
Date
Name
Owned For
Owner Type
Purchase Details
Closed on
Dec 30, 2015
Sold by
Nguyen Du V
Bought by
Nguyen Andy and Nguyen Loan P
Current Estimated Value
Purchase Details
Closed on
Mar 30, 1995
Sold by
Lemelin Richard P and Lemelin Sandra L
Bought by
Nguyen Du V
Home Financials for this Owner
Home Financials are based on the most recent Mortgage that was taken out on this home.
Original Mortgage
$85,600
Interest Rate
8.8%
Mortgage Type
Purchase Money Mortgage
Create a Home Valuation Report for This Property
The Home Valuation Report is an in-depth analysis detailing your home's value as well as a comparison with similar homes in the area
Home Values in the Area
Average Home Value in this Area
Purchase History
| Date | Buyer | Sale Price | Title Company |
|---|---|---|---|
| Nguyen Andy | -- | -- | |
| Nguyen Du V | $107,000 | -- |
Source: Public Records
Mortgage History
| Date | Status | Borrower | Loan Amount |
|---|---|---|---|
| Previous Owner | Nguyen Du V | $41,000 | |
| Previous Owner | Nguyen Du V | $85,600 |
Source: Public Records
Tax History
| Year | Tax Paid | Tax Assessment Tax Assessment Total Assessment is a certain percentage of the fair market value that is determined by local assessors to be the total taxable value of land and additions on the property. | Land | Improvement |
|---|---|---|---|---|
| 2025 | $3,986 | $262,900 | $55,200 | $207,700 |
| 2024 | $3,765 | $255,100 | $54,100 | $201,000 |
| 2023 | $3,513 | $231,900 | $49,200 | $182,700 |
| 2022 | $3,434 | $202,100 | $42,800 | $159,300 |
| 2021 | $3,330 | $184,900 | $38,900 | $146,000 |
| 2020 | $4,614 | $174,900 | $38,900 | $136,000 |
| 2019 | $4,835 | $164,200 | $38,900 | $125,300 |
| 2018 | $4,759 | $157,300 | $37,000 | $120,300 |
| 2017 | $2,751 | $158,900 | $41,700 | $117,200 |
| 2016 | $2,481 | $146,700 | $41,700 | $105,000 |
| 2015 | $2,431 | $138,600 | $41,700 | $96,900 |
| 2014 | $1,216 | $138,600 | $41,700 | $96,900 |
Source: Public Records
Map
Nearby Homes
Your Personal Tour Guide
Ask me questions while you tour the home.