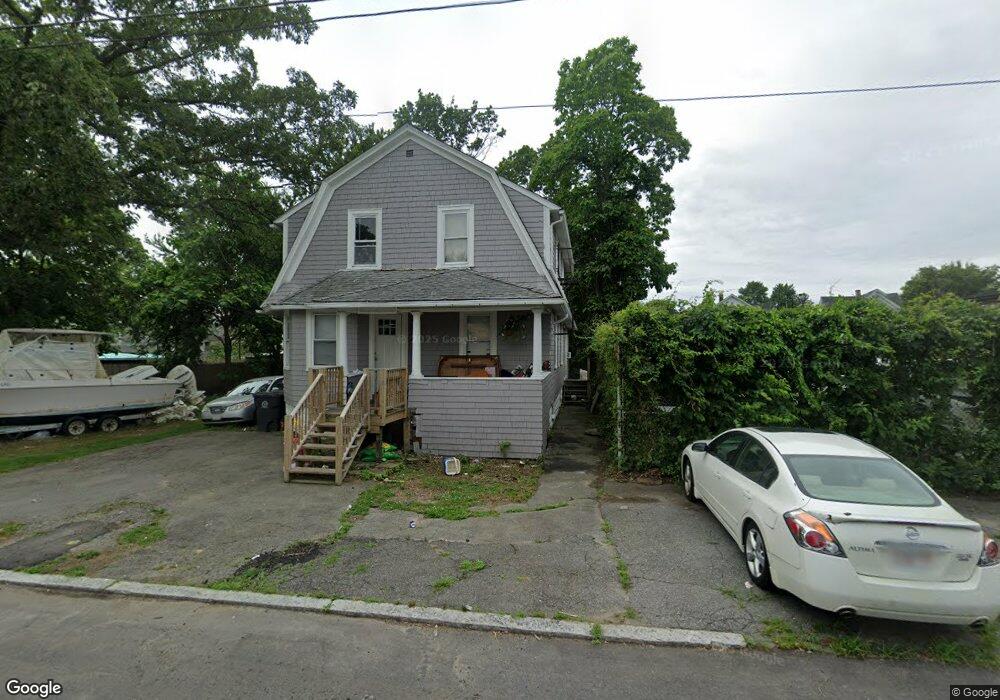
15 Blanding Ave East Providence, RI 02914
Estimated Value: $399,270 - $595,000
5
Beds
2
Baths
1,974
Sq Ft
$261/Sq Ft
Est. Value
About This Home
This home is located at 15 Blanding Ave, East Providence, RI 02914 and is currently estimated at $515,318, approximately $261 per square foot. 15 Blanding Ave is a home located in Providence County with nearby schools including East Providence High School, Ocean State Montessori School, and Lincoln School.
Ownership History
Date
Name
Owned For
Owner Type
Purchase Details
Closed on
Apr 7, 2025
Sold by
East Providence City Of
Bought by
Title Investment Iv Rigp
Current Estimated Value
Purchase Details
Closed on
Sep 12, 1994
Sold by
Britto Morris A and Britto Angelina
Bought by
Watson Mark S
Home Financials for this Owner
Home Financials are based on the most recent Mortgage that was taken out on this home.
Original Mortgage
$88,200
Interest Rate
8.54%
Mortgage Type
Purchase Money Mortgage
Create a Home Valuation Report for This Property
The Home Valuation Report is an in-depth analysis detailing your home's value as well as a comparison with similar homes in the area
Home Values in the Area
Average Home Value in this Area
Purchase History
| Date | Buyer | Sale Price | Title Company |
|---|---|---|---|
| Title Investment Iv Rigp | $2,288 | None Available | |
| Title Investment Iv Rigp | $2,288 | None Available | |
| Watson Mark S | $98,000 | -- | |
| Watson Mark S | $98,000 | -- |
Source: Public Records
Mortgage History
| Date | Status | Borrower | Loan Amount |
|---|---|---|---|
| Previous Owner | Watson Mark S | $157,000 | |
| Previous Owner | Watson Mark S | $88,200 |
Source: Public Records
Tax History Compared to Growth
Tax History
| Year | Tax Paid | Tax Assessment Tax Assessment Total Assessment is a certain percentage of the fair market value that is determined by local assessors to be the total taxable value of land and additions on the property. | Land | Improvement |
|---|---|---|---|---|
| 2025 | $5,845 | $447,200 | $99,000 | $348,200 |
| 2024 | $4,579 | $298,700 | $82,500 | $216,200 |
| 2023 | $4,409 | $298,700 | $82,500 | $216,200 |
| 2022 | $3,924 | $179,500 | $43,900 | $135,600 |
| 2021 | $3,859 | $179,500 | $43,000 | $136,500 |
| 2020 | $3,696 | $179,500 | $43,000 | $136,500 |
| 2019 | $3,594 | $179,500 | $43,000 | $136,500 |
| 2018 | $3,485 | $152,300 | $45,100 | $107,200 |
| 2017 | $3,407 | $152,300 | $45,100 | $107,200 |
| 2016 | $3,390 | $152,300 | $45,100 | $107,200 |
| 2015 | $3,188 | $138,900 | $36,500 | $102,400 |
| 2014 | $3,188 | $138,900 | $36,500 | $102,400 |
Source: Public Records
Map
Nearby Homes
- 58 Central Ave
- 115 Sutton Ave
- 181 Summit St
- 91 Ivy St
- 43 Mary Ave Unit 45
- 169 Wilmarth Ave
- 200 Woodward Ave
- 661 N Broadway
- 58 Summit St
- 674 N Broadway
- 152 Freeborn Ave
- 229 Medway St Unit 103
- 18 Baker St Unit 20
- 228 Medway St
- 41 What Cheer Ave
- 89 Warren Ave
- 93 Warren Ave
- 15 S Carpenter St
- 4 S Carpenter St
- 163 Butler Ave Unit 2