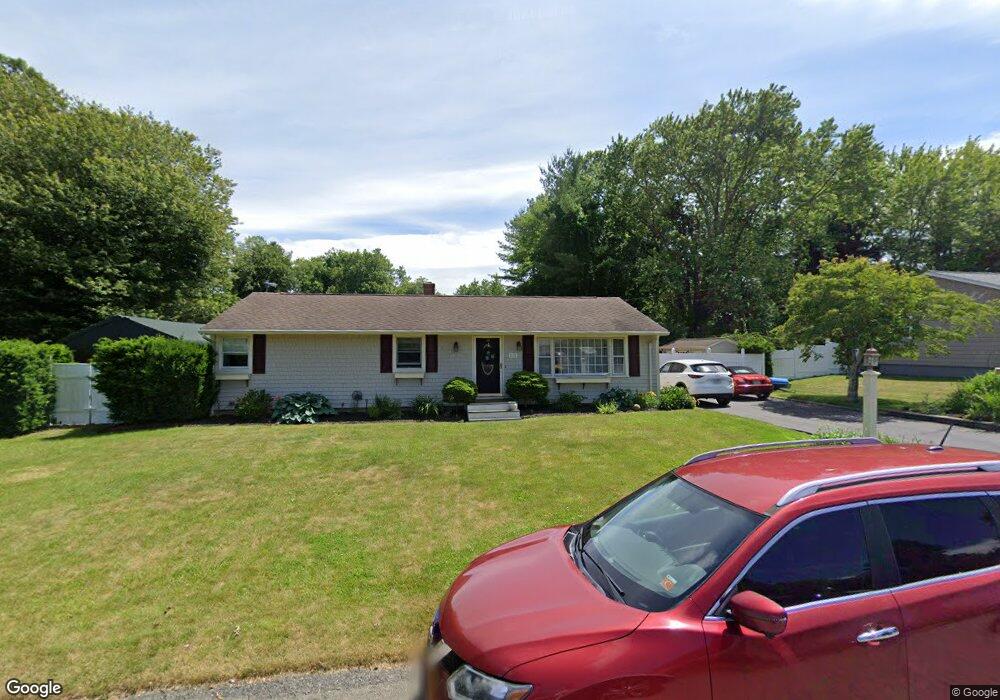
15 Bob St Westport, MA 02790
North Westport NeighborhoodEstimated Value: $429,000 - $537,000
3
Beds
--
Bath
1,296
Sq Ft
$366/Sq Ft
Est. Value
About This Home
This home is located at 15 Bob St, Westport, MA 02790 and is currently estimated at $473,992, approximately $365 per square foot. 15 Bob St is a home located in Bristol County with nearby schools including Alice A. Macomber Primary School, Westport Elementary School, and Westport Middle-High School.
Ownership History
Date
Name
Owned For
Owner Type
Purchase Details
Closed on
Aug 13, 2001
Sold by
Enos Reynold E and Enos Jean
Bought by
Enos Kerrie A and Raposo Francisco
Current Estimated Value
Home Financials for this Owner
Home Financials are based on the most recent Mortgage that was taken out on this home.
Original Mortgage
$118,400
Interest Rate
7.1%
Mortgage Type
Purchase Money Mortgage
Create a Home Valuation Report for This Property
The Home Valuation Report is an in-depth analysis detailing your home's value as well as a comparison with similar homes in the area
Home Values in the Area
Average Home Value in this Area
Purchase History
| Date | Buyer | Sale Price | Title Company |
|---|---|---|---|
| Enos Kerrie A | $148,000 | -- |
Source: Public Records
Mortgage History
| Date | Status | Borrower | Loan Amount |
|---|---|---|---|
| Open | Enos Kerrie A | $118,200 | |
| Closed | Enos Kerrie A | $118,400 | |
| Previous Owner | Enos Kerrie A | $56,000 |
Source: Public Records
Tax History Compared to Growth
Tax History
| Year | Tax Paid | Tax Assessment Tax Assessment Total Assessment is a certain percentage of the fair market value that is determined by local assessors to be the total taxable value of land and additions on the property. | Land | Improvement |
|---|---|---|---|---|
| 2025 | $2,619 | $351,600 | $157,900 | $193,700 |
| 2024 | $2,608 | $337,400 | $146,300 | $191,100 |
| 2023 | $2,490 | $305,200 | $133,300 | $171,900 |
| 2022 | $2,273 | $268,000 | $121,200 | $146,800 |
| 2021 | $2,214 | $256,900 | $110,100 | $146,800 |
| 2020 | $2,129 | $252,500 | $105,700 | $146,800 |
| 2019 | $2,086 | $252,200 | $105,700 | $146,500 |
| 2018 | $2,003 | $245,200 | $112,900 | $132,300 |
| 2017 | $1,934 | $242,700 | $112,900 | $129,800 |
| 2016 | $1,828 | $231,100 | $112,900 | $118,200 |
| 2015 | $1,735 | $218,800 | $112,900 | $105,900 |
Source: Public Records
Map
Nearby Homes