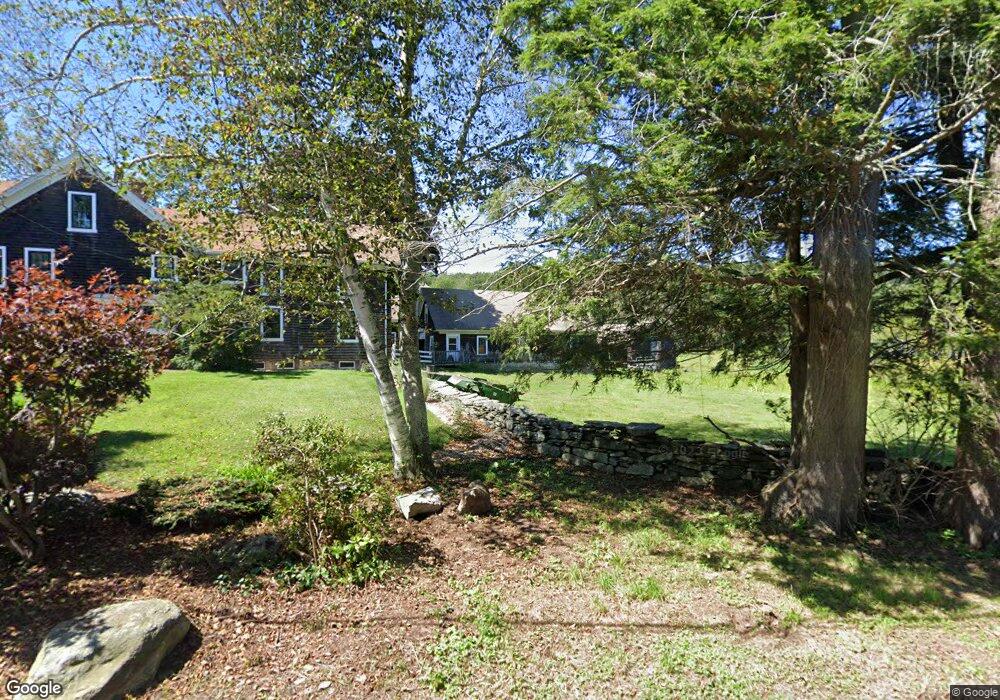
15 Bond St Leicester, MA 01524
Estimated Value: $649,000 - $688,650
4
Beds
2
Baths
3,100
Sq Ft
$216/Sq Ft
Est. Value
About This Home
This home is located at 15 Bond St, Leicester, MA 01524 and is currently estimated at $668,825, approximately $215 per square foot. 15 Bond St is a home located in Worcester County with nearby schools including Leicester Integrated Preschool, Leicester Memorial Elementary School, and Leicester Middle School.
Ownership History
Date
Name
Owned For
Owner Type
Purchase Details
Closed on
Mar 29, 2019
Sold by
Giggey-Moureau Farm Nt and Giggey
Bought by
Giggey Jay S
Current Estimated Value
Purchase Details
Closed on
May 27, 2014
Sold by
Giggey Robert L and Giggey Judith M
Bought by
Giggey Moreau Farm Nt and Giggey
Purchase Details
Closed on
Jul 18, 1963
Bought by
Giggey Moreau Farm Nt and Giggey, Robert L
Create a Home Valuation Report for This Property
The Home Valuation Report is an in-depth analysis detailing your home's value as well as a comparison with similar homes in the area
Home Values in the Area
Average Home Value in this Area
Purchase History
| Date | Buyer | Sale Price | Title Company |
|---|---|---|---|
| Giggey Jay S | -- | -- | |
| Giggey Jay S | -- | -- | |
| Giggey Jay S | -- | -- | |
| Giggey Moreau Farm Nt | -- | -- | |
| Giggey Moreau Farm Nt | -- | -- | |
| Giggey Moreau Farm Nt | -- | -- | |
| Giggey Moreau Farm Nt | -- | -- |
Source: Public Records
Tax History Compared to Growth
Tax History
| Year | Tax Paid | Tax Assessment Tax Assessment Total Assessment is a certain percentage of the fair market value that is determined by local assessors to be the total taxable value of land and additions on the property. | Land | Improvement |
|---|---|---|---|---|
| 2025 | $6,483 | $550,795 | $95,195 | $455,600 |
| 2024 | $6,229 | $496,325 | $83,025 | $413,300 |
| 2023 | $5,937 | $461,642 | $82,142 | $379,500 |
| 2022 | $5,713 | $408,363 | $78,263 | $330,100 |
| 2021 | $6,066 | $400,921 | $75,821 | $325,100 |
| 2020 | $5,137 | $344,521 | $72,021 | $272,500 |
| 2019 | $5,061 | $335,621 | $65,421 | $270,200 |
| 2018 | $4,928 | $306,291 | $65,391 | $240,900 |
| 2017 | $4,742 | $306,357 | $65,457 | $240,900 |
| 2016 | $4,674 | $313,691 | $79,991 | $233,700 |
Source: Public Records
Map
Nearby Homes