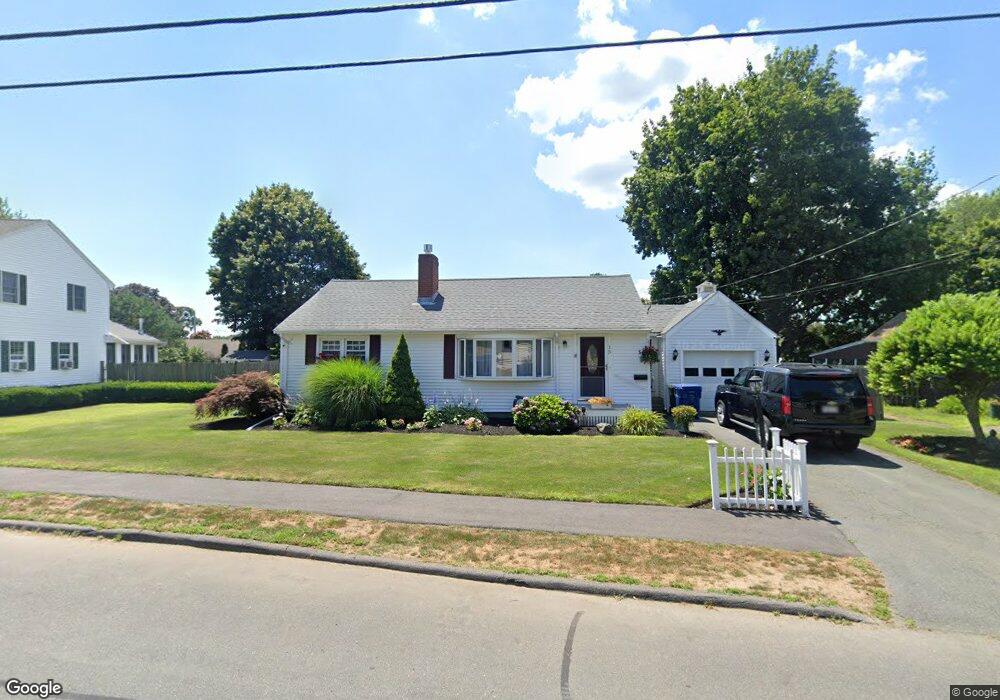
15 Bow St Danvers, MA 01923
Estimated Value: $661,553 - $700,000
3
Beds
3
Baths
1,642
Sq Ft
$412/Sq Ft
Est. Value
About This Home
This home is located at 15 Bow St, Danvers, MA 01923 and is currently estimated at $675,888, approximately $411 per square foot. 15 Bow St is a home located in Essex County with nearby schools including Danvers High School and St. Mary of the Annunciation School.
Ownership History
Date
Name
Owned For
Owner Type
Purchase Details
Closed on
Jun 27, 2022
Sold by
Farrell Charles C and Farrell Michelle
Bought by
Farrell Charles C and Farrell Michelle
Current Estimated Value
Home Financials for this Owner
Home Financials are based on the most recent Mortgage that was taken out on this home.
Original Mortgage
$333,740
Outstanding Balance
$317,046
Interest Rate
5.25%
Mortgage Type
FHA
Estimated Equity
$358,842
Purchase Details
Closed on
Mar 31, 2017
Sold by
Shirley A Farrell Irt and Francis
Bought by
Farrell Charles C and Farrell Michelle
Home Financials for this Owner
Home Financials are based on the most recent Mortgage that was taken out on this home.
Original Mortgage
$295,000
Interest Rate
4.15%
Mortgage Type
New Conventional
Purchase Details
Closed on
Oct 2, 2013
Sold by
Farrell Shirley A
Bought by
Shirley A Farrell Irt
Purchase Details
Closed on
Aug 22, 1986
Bought by
Farrell Shirley A
Create a Home Valuation Report for This Property
The Home Valuation Report is an in-depth analysis detailing your home's value as well as a comparison with similar homes in the area
Home Values in the Area
Average Home Value in this Area
Purchase History
| Date | Buyer | Sale Price | Title Company |
|---|---|---|---|
| Farrell Charles C | -- | None Available | |
| Farrell Charles C | -- | None Available | |
| Farrell Charles C | -- | None Available | |
| Farrell Charles C | $372,000 | -- | |
| Shirley A Farrell Irt | -- | -- | |
| Shirley A Farrell Irt | -- | -- | |
| Farrell Shirley A | -- | -- | |
| Shirley A Farrell Irt | -- | -- |
Source: Public Records
Mortgage History
| Date | Status | Borrower | Loan Amount |
|---|---|---|---|
| Open | Farrell Charles C | $333,740 | |
| Closed | Farrell Charles C | $333,740 | |
| Previous Owner | Farrell Charles C | $295,000 | |
| Previous Owner | Farrell Shirley A | $35,000 | |
| Previous Owner | Farrell Shirley A | $25,000 |
Source: Public Records
Tax History
| Year | Tax Paid | Tax Assessment Tax Assessment Total Assessment is a certain percentage of the fair market value that is determined by local assessors to be the total taxable value of land and additions on the property. | Land | Improvement |
|---|---|---|---|---|
| 2025 | $6,336 | $576,500 | $337,200 | $239,300 |
| 2024 | $6,318 | $568,700 | $337,200 | $231,500 |
| 2023 | $6,056 | $515,400 | $306,400 | $209,000 |
| 2022 | $5,954 | $470,300 | $278,100 | $192,200 |
| 2021 | $5,731 | $429,300 | $263,400 | $165,900 |
| 2020 | $5,564 | $426,000 | $260,300 | $165,700 |
| 2019 | $5,343 | $402,300 | $236,600 | $165,700 |
| 2018 | $4,989 | $368,500 | $234,300 | $134,200 |
| 2017 | $4,785 | $337,200 | $204,700 | $132,500 |
| 2016 | $4,572 | $322,000 | $195,200 | $126,800 |
| 2015 | $4,373 | $293,300 | $177,500 | $115,800 |
Source: Public Records
Map
Nearby Homes
- 47 Collins St Unit 50
- 97 Sylvan St Unit 7
- 63 Adams St
- 10 Clark St
- 22 Braman St
- 18 Wadsworth St
- 152 Endicott St
- 21 Olsen Rd
- 14 Williams St Unit C17
- 108 Abington Rd Unit 108
- 9 Ledgewood Way Unit 6
- 5 Holten St
- 10 Ledgewood Way Unit 26
- 43 Hobart St Unit B
- 8 Ledgewood Way Unit 20
- 7 Ledgewood Way Unit 8
- 437 Lowell St
- 6 Grant St
- 12 Ledgewood Way Unit 8
- 3 Ledgewood Way Unit 8
Your Personal Tour Guide
Ask me questions while you tour the home.