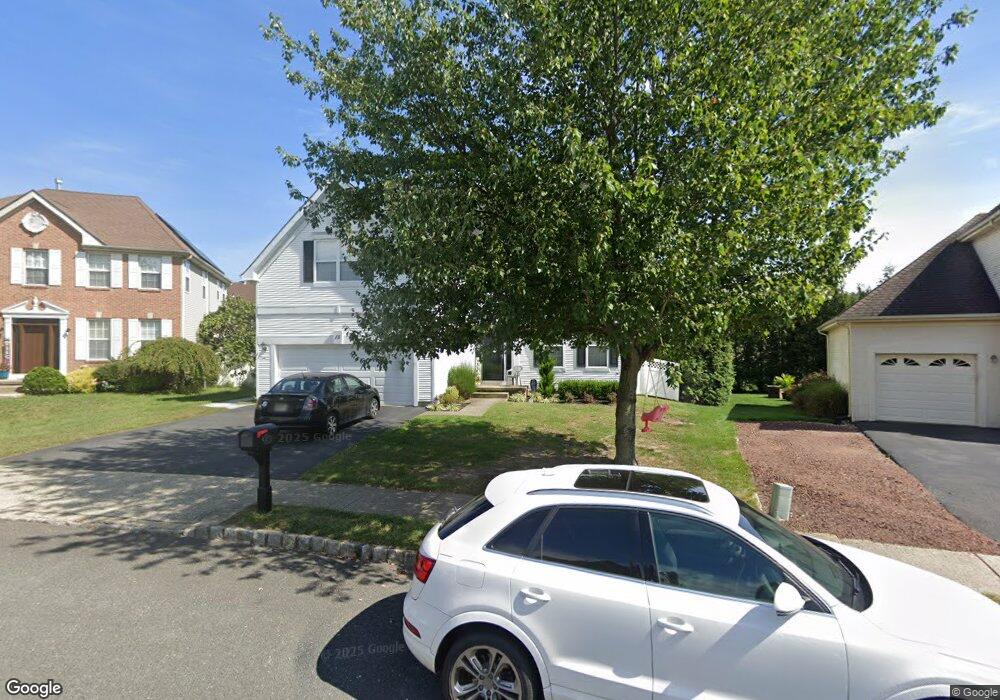
15 Brent Dr Howell, NJ 07731
Salem Hill NeighborhoodEstimated Value: $856,619 - $925,000
4
Beds
3
Baths
2,551
Sq Ft
$352/Sq Ft
Est. Value
About This Home
This home is located at 15 Brent Dr, Howell, NJ 07731 and is currently estimated at $898,905, approximately $352 per square foot. 15 Brent Dr is a home located in Monmouth County with nearby schools including Land O' Pines School, Newbury School, and Howell Middle School North.
Ownership History
Date
Name
Owned For
Owner Type
Purchase Details
Closed on
Jul 12, 1999
Sold by
Walisiak Daniel
Bought by
Gedell Steve and Gedell Victoria
Current Estimated Value
Home Financials for this Owner
Home Financials are based on the most recent Mortgage that was taken out on this home.
Original Mortgage
$208,000
Outstanding Balance
$56,561
Interest Rate
7.19%
Estimated Equity
$842,344
Purchase Details
Closed on
Feb 23, 1996
Sold by
Calton Homes
Bought by
Walisiak Daniel and Walisiak Lori
Home Financials for this Owner
Home Financials are based on the most recent Mortgage that was taken out on this home.
Original Mortgage
$159,000
Interest Rate
7.02%
Create a Home Valuation Report for This Property
The Home Valuation Report is an in-depth analysis detailing your home's value as well as a comparison with similar homes in the area
Home Values in the Area
Average Home Value in this Area
Purchase History
| Date | Buyer | Sale Price | Title Company |
|---|---|---|---|
| Gedell Steve | $244,000 | -- | |
| Walisiak Daniel | $212,990 | -- |
Source: Public Records
Mortgage History
| Date | Status | Borrower | Loan Amount |
|---|---|---|---|
| Open | Gedell Steve | $208,000 | |
| Previous Owner | Walisiak Daniel | $159,000 |
Source: Public Records
Tax History
| Year | Tax Paid | Tax Assessment Tax Assessment Total Assessment is a certain percentage of the fair market value that is determined by local assessors to be the total taxable value of land and additions on the property. | Land | Improvement |
|---|---|---|---|---|
| 2025 | $11,920 | $747,100 | $386,000 | $361,100 |
| 2024 | $10,928 | $670,400 | $316,000 | $354,400 |
Source: Public Records
Map
Nearby Homes
Your Personal Tour Guide
Ask me questions while you tour the home.