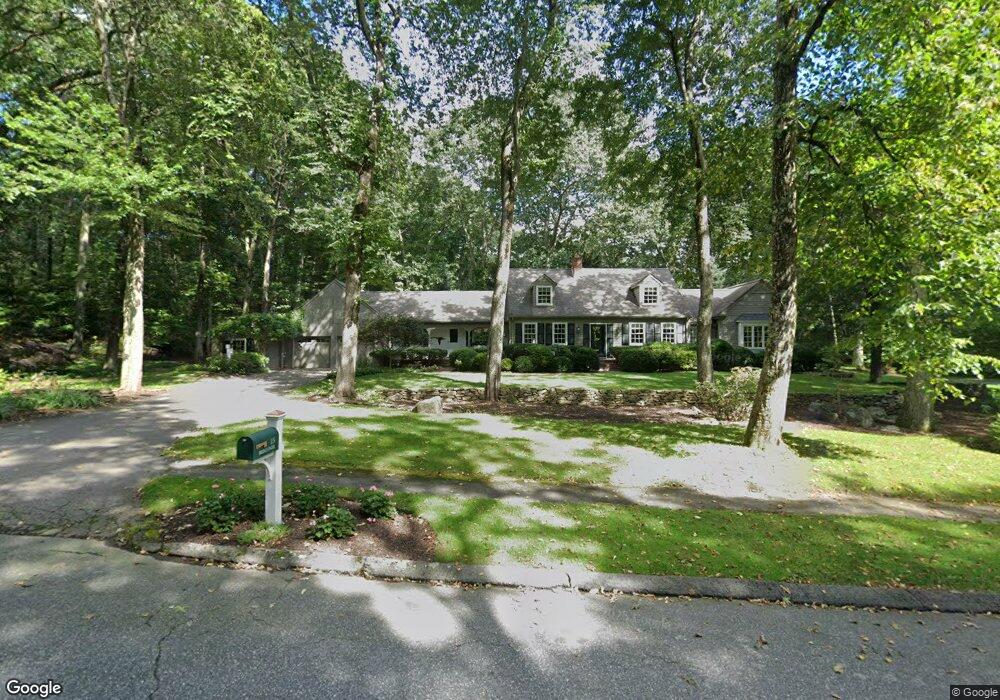
15 Bridle Path Sherborn, MA 01770
Estimated Value: $1,214,778 - $1,403,000
4
Beds
4
Baths
3,208
Sq Ft
$400/Sq Ft
Est. Value
About This Home
This home is located at 15 Bridle Path, Sherborn, MA 01770 and is currently estimated at $1,282,945, approximately $399 per square foot. 15 Bridle Path is a home located in Middlesex County with nearby schools including Pine Hill Elementary School, Dover-Sherborn Regional Middle School, and Dover-Sherborn Regional High School.
Ownership History
Date
Name
Owned For
Owner Type
Purchase Details
Closed on
Apr 17, 1985
Bought by
Vaccarino James M and Vaccarino Joan A
Current Estimated Value
Create a Home Valuation Report for This Property
The Home Valuation Report is an in-depth analysis detailing your home's value as well as a comparison with similar homes in the area
Home Values in the Area
Average Home Value in this Area
Purchase History
| Date | Buyer | Sale Price | Title Company |
|---|---|---|---|
| Vaccarino James M | $247,500 | -- |
Source: Public Records
Mortgage History
| Date | Status | Borrower | Loan Amount |
|---|---|---|---|
| Open | Vaccarino James M | $276,000 | |
| Closed | Vaccarino James M | $140,000 | |
| Closed | Vaccarino James M | $115,000 |
Source: Public Records
Tax History
| Year | Tax Paid | Tax Assessment Tax Assessment Total Assessment is a certain percentage of the fair market value that is determined by local assessors to be the total taxable value of land and additions on the property. | Land | Improvement |
|---|---|---|---|---|
| 2025 | $18,725 | $1,129,400 | $455,600 | $673,800 |
| 2024 | $18,887 | $1,114,300 | $455,600 | $658,700 |
| 2023 | $18,693 | $1,037,900 | $455,600 | $582,300 |
| 2022 | $17,178 | $902,700 | $445,200 | $457,500 |
| 2021 | $6,527 | $894,600 | $445,200 | $449,400 |
| 2020 | $16,362 | $840,800 | $445,200 | $395,600 |
| 2019 | $15,441 | $787,000 | $445,200 | $341,800 |
| 2018 | $15,189 | $787,000 | $445,200 | $341,800 |
| 2017 | $15,294 | $747,500 | $445,200 | $302,300 |
| 2016 | $15,265 | $742,100 | $445,200 | $296,900 |
| 2015 | $15,077 | $742,000 | $440,200 | $301,800 |
| 2014 | $14,661 | $720,800 | $420,200 | $300,600 |
Source: Public Records
Map
Nearby Homes
- 14 Sewall Brook Ln
- 5 Farm Rd
- 32 Cider Hill Ln
- 65 Farm Road Lot 6
- 174 S Main St
- 90 Maple St
- 137 Lake St
- 20 Nason Hill Rd
- 59 Spywood Rd
- 14 Fiske Pond Rd
- 00000 S Main St and Bullard St
- 27 Spywood Rd
- 21 Spywood Rd
- 615 Mayflower Landing
- 6 Hopewell Farm Rd
- 81 Brush Hill Rd
- 103 Farm St
- 114 Farm St
- 9 Adams Ln Unit 9
- 1 Adams Ln Unit 1
Your Personal Tour Guide
Ask me questions while you tour the home.