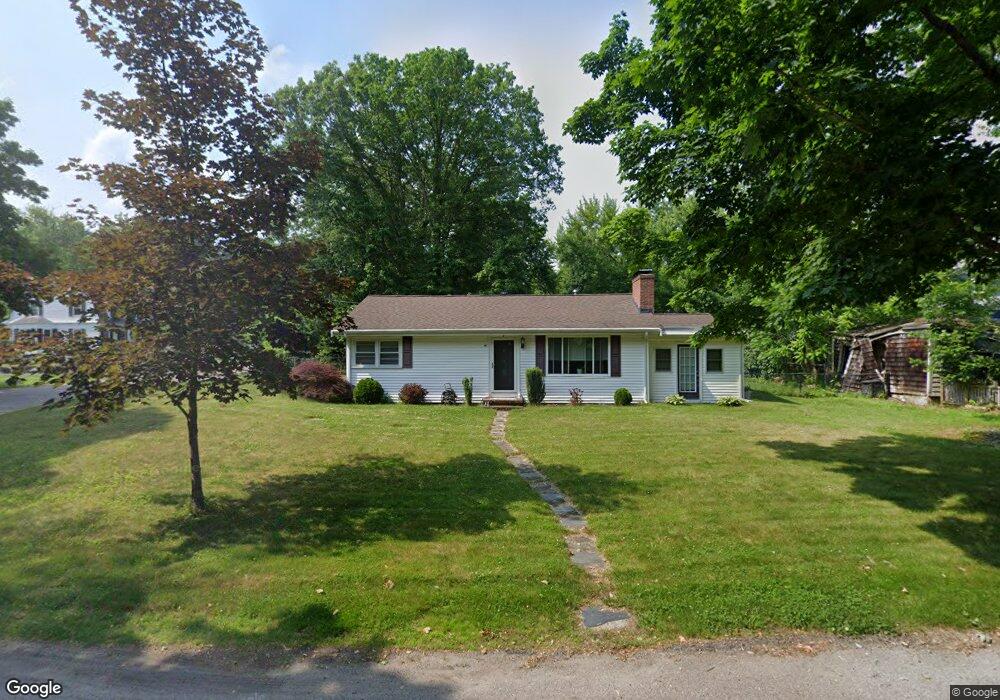
15 Buttonwood Ave West Bridgewater, MA 02379
Estimated Value: $413,000 - $467,000
3
Beds
1
Bath
1,176
Sq Ft
$385/Sq Ft
Est. Value
About This Home
This home is located at 15 Buttonwood Ave, West Bridgewater, MA 02379 and is currently estimated at $452,180, approximately $384 per square foot. 15 Buttonwood Ave is a home located in Plymouth County with nearby schools including Spring Street Elementary School, Rose L. MacDonald Elementary School, and Howard Elementary School.
Ownership History
Date
Name
Owned For
Owner Type
Purchase Details
Closed on
Sep 27, 2006
Sold by
Machardy Debora A
Bought by
Ferrara Ernest J and Dugre Leanne M
Current Estimated Value
Home Financials for this Owner
Home Financials are based on the most recent Mortgage that was taken out on this home.
Original Mortgage
$178,000
Interest Rate
6.52%
Mortgage Type
Purchase Money Mortgage
Purchase Details
Closed on
May 17, 2005
Sold by
Stroedter Robert
Bought by
Machardy Debora A
Home Financials for this Owner
Home Financials are based on the most recent Mortgage that was taken out on this home.
Original Mortgage
$155,000
Interest Rate
6.05%
Mortgage Type
Purchase Money Mortgage
Purchase Details
Closed on
Dec 30, 1998
Sold by
Berry Francis C
Bought by
Machardy Debora A and Stroedter Robert
Purchase Details
Closed on
Jun 23, 1989
Sold by
Nevins Roger A
Bought by
Berry Francis C
Create a Home Valuation Report for This Property
The Home Valuation Report is an in-depth analysis detailing your home's value as well as a comparison with similar homes in the area
Home Values in the Area
Average Home Value in this Area
Purchase History
| Date | Buyer | Sale Price | Title Company |
|---|---|---|---|
| Ferrara Ernest J | $222,500 | -- | |
| Machardy Debora A | -- | -- | |
| Machardy Debora A | $140,900 | -- | |
| Berry Francis C | $131,000 | -- |
Source: Public Records
Mortgage History
| Date | Status | Borrower | Loan Amount |
|---|---|---|---|
| Open | Berry Francis C | $180,000 | |
| Closed | Berry Francis C | $178,000 | |
| Previous Owner | Berry Francis C | $155,000 |
Source: Public Records
Tax History Compared to Growth
Tax History
| Year | Tax Paid | Tax Assessment Tax Assessment Total Assessment is a certain percentage of the fair market value that is determined by local assessors to be the total taxable value of land and additions on the property. | Land | Improvement |
|---|---|---|---|---|
| 2025 | $4,894 | $358,000 | $211,000 | $147,000 |
| 2024 | $4,588 | $323,800 | $192,500 | $131,300 |
| 2023 | $4,408 | $286,800 | $172,200 | $114,600 |
| 2022 | $4,224 | $260,400 | $159,200 | $101,200 |
| 2021 | $6,077 | $241,500 | $151,800 | $89,700 |
| 2020 | $3,912 | $239,000 | $151,800 | $87,200 |
| 2019 | $3,923 | $237,300 | $151,800 | $85,500 |
| 2018 | $3,619 | $216,100 | $138,800 | $77,300 |
| 2017 | $3,589 | $202,400 | $129,600 | $72,800 |
| 2016 | $3,542 | $196,800 | $124,000 | $72,800 |
| 2015 | $3,477 | $195,200 | $124,000 | $71,200 |
| 2014 | $3,062 | $185,700 | $117,000 | $68,700 |
Source: Public Records
Map
Nearby Homes