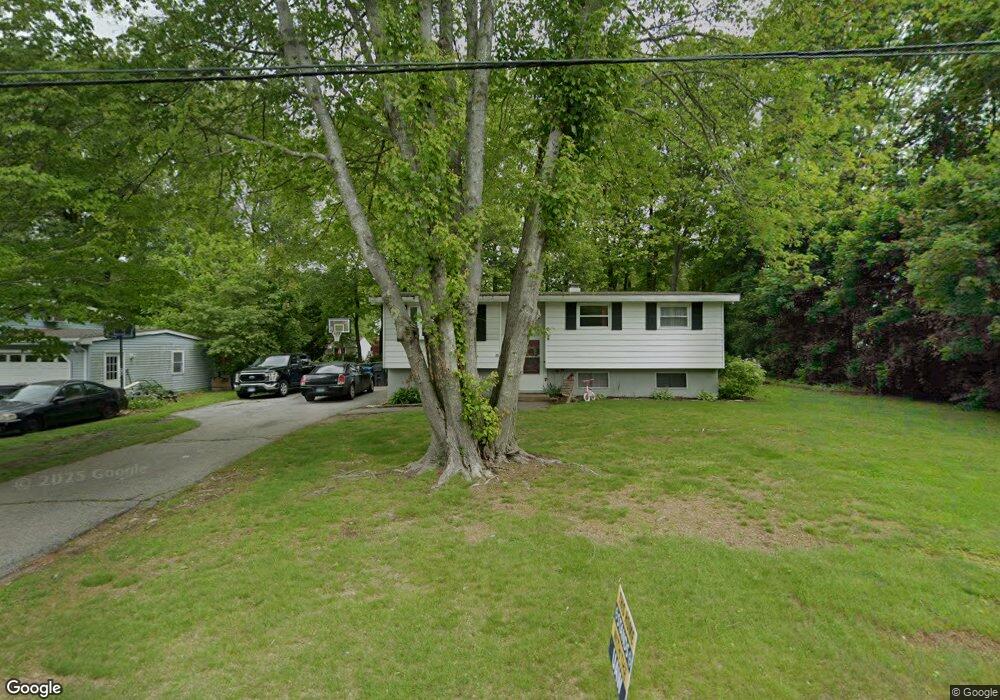
15 Carriage Trail Ledyard, CT 06339
Estimated Value: $325,000 - $352,768
3
Beds
2
Baths
1,028
Sq Ft
$332/Sq Ft
Est. Value
About This Home
This home is located at 15 Carriage Trail, Ledyard, CT 06339 and is currently estimated at $341,692, approximately $332 per square foot. 15 Carriage Trail is a home located in New London County with nearby schools including Ledyard Middle School and Ledyard High School.
Ownership History
Date
Name
Owned For
Owner Type
Purchase Details
Closed on
Oct 30, 2018
Sold by
Bowes Scot D
Bought by
Hemme Christopher M and Hemme Jessica
Current Estimated Value
Home Financials for this Owner
Home Financials are based on the most recent Mortgage that was taken out on this home.
Original Mortgage
$184,167
Outstanding Balance
$161,272
Interest Rate
4.6%
Mortgage Type
New Conventional
Estimated Equity
$180,420
Purchase Details
Closed on
Feb 10, 2005
Sold by
Tylaska Laurie
Bought by
Lee Lonnie and Bowes Scot
Home Financials for this Owner
Home Financials are based on the most recent Mortgage that was taken out on this home.
Original Mortgage
$191,950
Interest Rate
5.83%
Mortgage Type
Purchase Money Mortgage
Purchase Details
Closed on
Feb 22, 1999
Sold by
Scholtz Sally May
Bought by
Carroll Laurie A
Home Financials for this Owner
Home Financials are based on the most recent Mortgage that was taken out on this home.
Original Mortgage
$100,700
Interest Rate
6.75%
Mortgage Type
Purchase Money Mortgage
Create a Home Valuation Report for This Property
The Home Valuation Report is an in-depth analysis detailing your home's value as well as a comparison with similar homes in the area
Home Values in the Area
Average Home Value in this Area
Purchase History
| Date | Buyer | Sale Price | Title Company |
|---|---|---|---|
| Hemme Christopher M | $181,000 | -- | |
| Lee Lonnie | $195,000 | -- | |
| Carroll Laurie A | $106,000 | -- |
Source: Public Records
Mortgage History
| Date | Status | Borrower | Loan Amount |
|---|---|---|---|
| Open | Hemme Christopher M | $184,167 | |
| Previous Owner | Carroll Laurie A | $191,950 | |
| Previous Owner | Carroll Laurie A | $100,700 |
Source: Public Records
Tax History
| Year | Tax Paid | Tax Assessment Tax Assessment Total Assessment is a certain percentage of the fair market value that is determined by local assessors to be the total taxable value of land and additions on the property. | Land | Improvement |
|---|---|---|---|---|
| 2025 | $4,654 | $125,300 | $42,280 | $83,020 |
| 2024 | $4,399 | $124,950 | $42,280 | $82,670 |
| 2023 | $4,318 | $124,950 | $42,280 | $82,670 |
| 2022 | $4,226 | $124,950 | $42,280 | $82,670 |
| 2021 | $4,198 | $124,950 | $42,280 | $82,670 |
| 2020 | $3,804 | $108,780 | $33,810 | $74,970 |
| 2019 | $3,814 | $108,780 | $33,810 | $74,970 |
| 2018 | $3,730 | $108,780 | $33,810 | $74,970 |
| 2017 | $3,540 | $108,780 | $33,810 | $74,970 |
| 2016 | $3,470 | $108,780 | $33,810 | $74,970 |
| 2015 | $3,307 | $108,780 | $33,810 | $74,970 |
| 2014 | $3,313 | $110,810 | $33,810 | $77,000 |
Source: Public Records
Map
Nearby Homes
- 14 Pennywise Ln
- 62 Highland Dr
- 115 Meeting House Ln
- 22 Boulder Way
- 20 Lakeside Dr Unit K
- 497 Colonel Ledyard Hwy
- 575 Shewville Rd
- 669 Colonel Ledyard Hwy
- 459 Colonel Ledyard Hwy
- 69 Wendell Comrie Rd
- 419 Colonel Ledyard Hwy
- 24 Fairway Dr Unit 9
- 449 Lantern Hill Rd
- 39 Long Pond Rd S
- 332 Lantern Hill Rd
- 3 Hilltop Dr
- Lot 5 Lantern Hill Rd
- 188 Wolf Neck Rd
- 25 Coachman Pike
- 28 Golden Spur
- 13 Carriage Trail
- 35 Meeting House Ln
- 37 Meeting House Ln
- 18 Pennywise Ln
- 16 Pennywise Ln
- 11 Carriage Trail
- 16 Carriage Trail
- 39 Meeting House Ln
- 31 Meeting House Ln
- 14 Carriage Trail
- 12 Carriage Trail
- 9 Carriage Trail
- 29 Meeting House Ln
- 29 Meeting House Ln Unit A
- 34 Meeting House Ln
- 36 Meeting House Ln
- 12 Pennywise Ln
- 32 Meeting House Ln
- 17 Pennywise Ln
- 41 Meeting House Ln
Your Personal Tour Guide
Ask me questions while you tour the home.