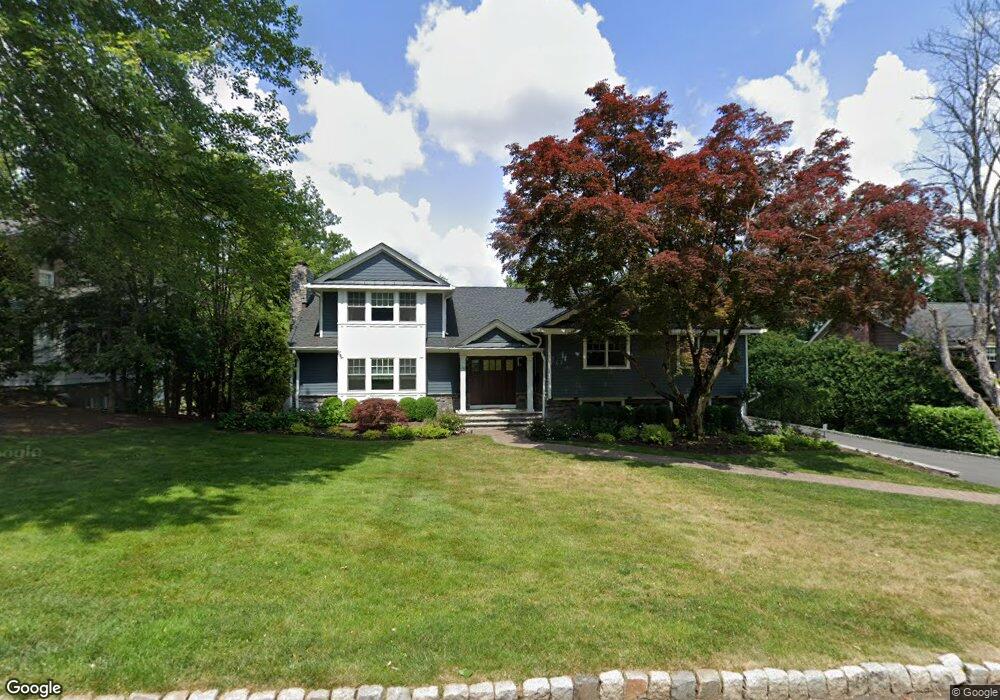
15 Cayuga Way Short Hills, NJ 07078
Estimated Value: $2,381,000 - $2,915,000
--
Bed
--
Bath
3,908
Sq Ft
$660/Sq Ft
Est. Value
About This Home
This home is located at 15 Cayuga Way, Short Hills, NJ 07078 and is currently estimated at $2,577,721, approximately $659 per square foot. 15 Cayuga Way is a home located in Essex County with nearby schools including Deerfield Elementary School, Millburn Middle School, and Millburn High School.
Ownership History
Date
Name
Owned For
Owner Type
Purchase Details
Closed on
Nov 16, 2005
Sold by
Simon Saul
Bought by
Sterling Kevin and Sterling Kristin
Current Estimated Value
Home Financials for this Owner
Home Financials are based on the most recent Mortgage that was taken out on this home.
Original Mortgage
$985,000
Outstanding Balance
$551,180
Interest Rate
6.39%
Mortgage Type
New Conventional
Estimated Equity
$2,026,541
Purchase Details
Closed on
Jan 5, 2001
Sold by
Hou John
Bought by
Simon Saul M and Simon Carolyn
Home Financials for this Owner
Home Financials are based on the most recent Mortgage that was taken out on this home.
Original Mortgage
$810,937
Interest Rate
7.39%
Purchase Details
Closed on
Dec 6, 1989
Sold by
Hou Peter and Hou Kathleen
Bought by
Hou James and Hou John
Create a Home Valuation Report for This Property
The Home Valuation Report is an in-depth analysis detailing your home's value as well as a comparison with similar homes in the area
Home Values in the Area
Average Home Value in this Area
Purchase History
| Date | Buyer | Sale Price | Title Company |
|---|---|---|---|
| Sterling Kevin | $1,510,000 | -- | |
| Simon Saul M | $865,000 | -- | |
| Hou James | $80,000 | -- |
Source: Public Records
Mortgage History
| Date | Status | Borrower | Loan Amount |
|---|---|---|---|
| Open | Sterling Kevin | $985,000 | |
| Previous Owner | Simon Saul M | $810,937 |
Source: Public Records
Tax History Compared to Growth
Tax History
| Year | Tax Paid | Tax Assessment Tax Assessment Total Assessment is a certain percentage of the fair market value that is determined by local assessors to be the total taxable value of land and additions on the property. | Land | Improvement |
|---|---|---|---|---|
| 2025 | $33,547 | $1,715,100 | $750,600 | $964,500 |
| 2024 | $33,547 | $1,715,100 | $750,600 | $964,500 |
| 2022 | $33,324 | $1,715,100 | $750,600 | $964,500 |
| 2021 | $33,239 | $1,715,100 | $750,600 | $964,500 |
| 2020 | $33,033 | $1,715,100 | $750,600 | $964,500 |
| 2019 | $33,101 | $1,715,100 | $750,600 | $964,500 |
| 2018 | $32,621 | $1,715,100 | $750,600 | $964,500 |
| 2017 | $31,832 | $1,715,100 | $750,600 | $964,500 |
| 2016 | $29,441 | $1,366,800 | $507,400 | $859,400 |
| 2015 | $28,771 | $1,366,800 | $507,400 | $859,400 |
| 2014 | $27,555 | $1,366,800 | $507,400 | $859,400 |
Source: Public Records
Map
Nearby Homes
- 71 Cayuga Way
- 24 Seminole Way
- 18 Deer Path
- 40 Lee Terrace
- 466 White Oak Ridge Rd
- 290 Long Hill Dr
- 470 White Oak Ridge Rd
- 303 White Oak Ridge Rd
- 496 White Oak Ridge Rd
- 14 Dorset Ln
- 26 Dorset Ln
- 330 Hartshorn Dr
- 148 Great Hills Rd
- 4 Athens Rd
- 44 W Beechcroft Rd
- 18 S Beechcroft Rd
- 293 Old Short Hills Rd
- 2 Kenilworth Dr
- 55 Troy Dr
- 81 Athens Rd