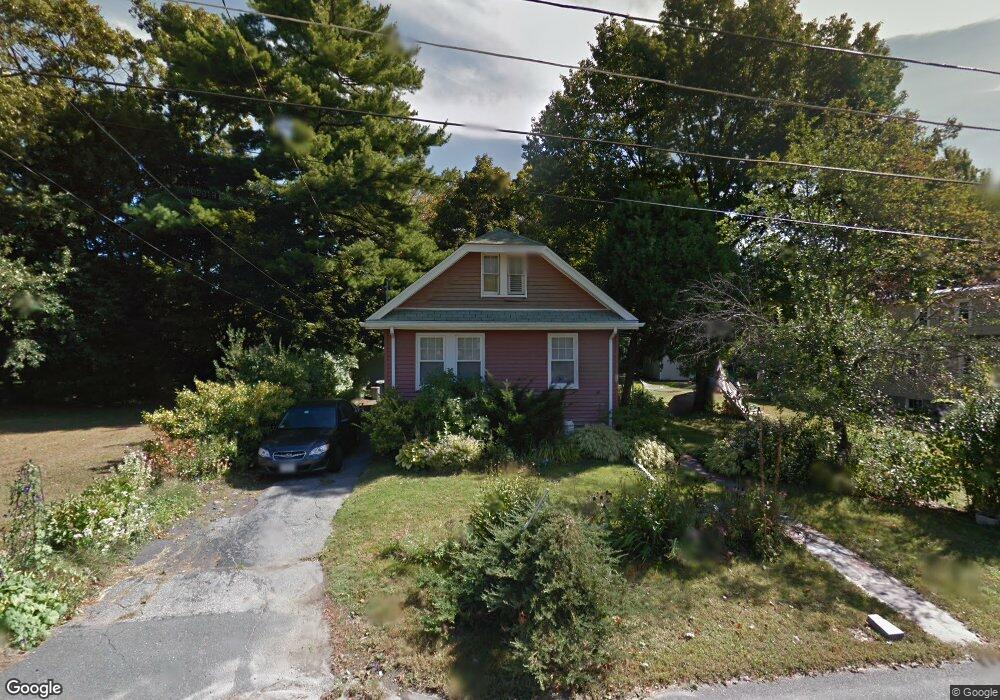
15 Cedarway Stoneham, MA 02180
Colonial Park NeighborhoodEstimated Value: $601,000 - $659,000
3
Beds
1
Bath
826
Sq Ft
$759/Sq Ft
Est. Value
About This Home
This home is located at 15 Cedarway, Stoneham, MA 02180 and is currently estimated at $627,014, approximately $759 per square foot. 15 Cedarway is a home located in Middlesex County with nearby schools including Stoneham High School, St. Patrick Elementary School, and Greater Boston Academy.
Ownership History
Date
Name
Owned For
Owner Type
Purchase Details
Closed on
Jun 28, 2011
Sold by
Travaglino Richard L
Bought by
Travaglino Richard L and Buck Tyler
Current Estimated Value
Purchase Details
Closed on
Oct 8, 1999
Sold by
Kenney Gilbert H and Fontaine Lea A
Bought by
Travaglino Richard L
Home Financials for this Owner
Home Financials are based on the most recent Mortgage that was taken out on this home.
Original Mortgage
$124,000
Interest Rate
7.81%
Mortgage Type
Purchase Money Mortgage
Create a Home Valuation Report for This Property
The Home Valuation Report is an in-depth analysis detailing your home's value as well as a comparison with similar homes in the area
Home Values in the Area
Average Home Value in this Area
Purchase History
| Date | Buyer | Sale Price | Title Company |
|---|---|---|---|
| Travaglino Richard L | -- | -- | |
| Travaglino Richard L | $155,000 | -- |
Source: Public Records
Mortgage History
| Date | Status | Borrower | Loan Amount |
|---|---|---|---|
| Previous Owner | Travaglino Richard L | $124,000 |
Source: Public Records
Tax History Compared to Growth
Tax History
| Year | Tax Paid | Tax Assessment Tax Assessment Total Assessment is a certain percentage of the fair market value that is determined by local assessors to be the total taxable value of land and additions on the property. | Land | Improvement |
|---|---|---|---|---|
| 2025 | $4,987 | $487,500 | $346,500 | $141,000 |
| 2024 | $4,845 | $457,500 | $319,200 | $138,300 |
| 2023 | $4,774 | $430,100 | $291,800 | $138,300 |
| 2022 | $4,116 | $395,400 | $264,400 | $131,000 |
| 2021 | $4,141 | $382,700 | $255,300 | $127,400 |
| 2020 | $4,007 | $371,400 | $241,400 | $130,000 |
| 2019 | $4,000 | $356,500 | $232,400 | $124,100 |
| 2018 | $3,796 | $324,200 | $205,700 | $118,500 |
| 2017 | $3,726 | $300,700 | $189,000 | $111,700 |
| 2016 | $3,612 | $284,400 | $189,000 | $95,400 |
| 2015 | $3,489 | $269,200 | $180,400 | $88,800 |
| 2014 | $3,459 | $256,400 | $171,800 | $84,600 |
Source: Public Records
Map
Nearby Homes