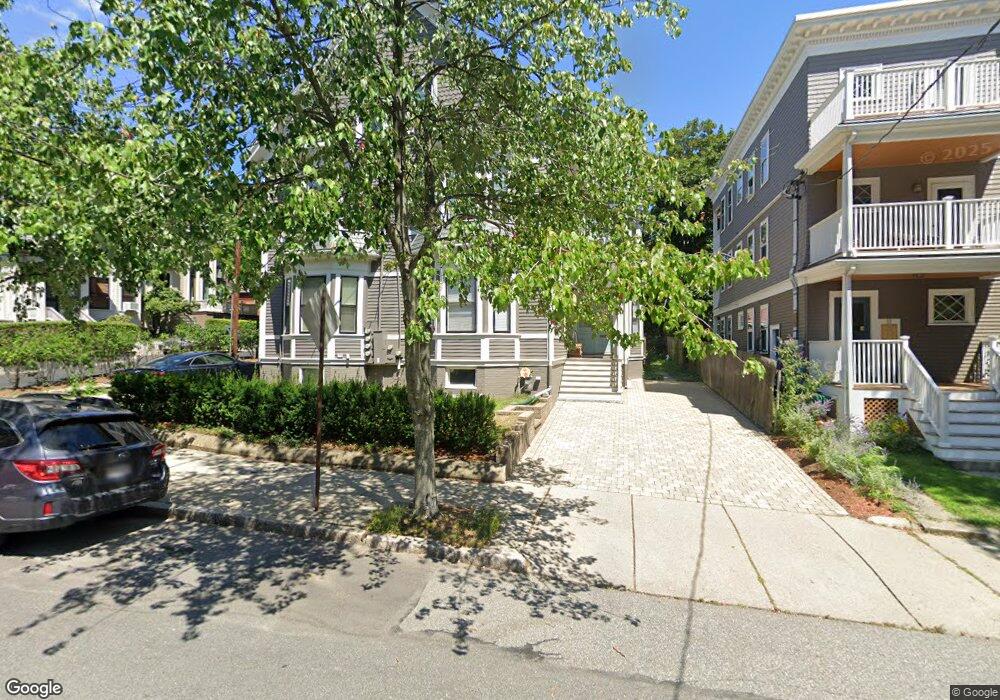
15 Centre St Cambridge, MA 02139
Mid-Cambridge NeighborhoodEstimated Value: $2,274,000 - $2,761,314
3
Beds
3
Baths
9,999
Sq Ft
$256/Sq Ft
Est. Value
About This Home
In Mid-Cambridge, between 2 of the area's hottest neighborhoods! Nearly equal distance to Harvard Square & Central Square where you can find unique shopping, trendy dining, exciting nightlife & bars, historic sites, and much more! Under 1/2 mile to the Red Line at Central station as well as many major MBTA bus routes for an easy commute! Convenient to Harvard University, Lesley University, Kendall Square, MIT, Inman Square, parks along the Charles River, Harvard Business School, Cambridgeport, as well as a quick ride on the Red Line to Downtown Boston, Mass General Hospital, Boston Common, South Station commuter trains, Beacon Hill, and all that the Boston area has to offer!
Ownership History
Date
Name
Owned For
Owner Type
Purchase Details
Closed on
Dec 20, 1982
Bought by
Meshoulam Uriel and Meshoulam Rahel
Current Estimated Value
Create a Home Valuation Report for This Property
The Home Valuation Report is an in-depth analysis detailing your home's value as well as a comparison with similar homes in the area
Home Values in the Area
Average Home Value in this Area
Purchase History
| Date | Buyer | Sale Price | Title Company |
|---|---|---|---|
| Meshoulam Uriel | $90,000 | -- |
Source: Public Records
Mortgage History
| Date | Status | Borrower | Loan Amount |
|---|---|---|---|
| Open | Meshoulam Uriel | $288,500 | |
| Open | Meshoulam Uriel | $500,000 | |
| Closed | Meshoulam Uriel | $227,000 |
Source: Public Records
Property History
| Date | Event | Price | List to Sale | Price per Sq Ft |
|---|---|---|---|---|
| 10/08/2024 10/08/24 | Off Market | $3,800 | -- | -- |
| 10/08/2024 10/08/24 | Off Market | $3,950 | -- | -- |
| 10/08/2024 10/08/24 | Off Market | $2,850 | -- | -- |
| 09/01/2024 09/01/24 | For Rent | $3,800 | +33.3% | -- |
| 06/02/2024 06/02/24 | For Rent | $2,850 | -27.8% | -- |
| 05/31/2024 05/31/24 | For Rent | $3,950 | -- | -- |
Tax History Compared to Growth
Tax History
| Year | Tax Paid | Tax Assessment Tax Assessment Total Assessment is a certain percentage of the fair market value that is determined by local assessors to be the total taxable value of land and additions on the property. | Land | Improvement |
|---|---|---|---|---|
| 2025 | $15,309 | $2,410,900 | $906,300 | $1,504,600 |
| 2024 | $14,187 | $2,396,400 | $956,400 | $1,440,000 |
| 2023 | $12,866 | $2,195,500 | $951,000 | $1,244,500 |
| 2022 | $12,281 | $2,074,500 | $973,600 | $1,100,900 |
| 2021 | $11,178 | $1,910,700 | $887,900 | $1,022,800 |
| 2020 | $10,564 | $1,837,200 | $868,600 | $968,600 |
| 2019 | $9,840 | $1,656,600 | $762,900 | $893,700 |
| 2018 | $9,697 | $1,541,700 | $689,600 | $852,100 |
| 2017 | $9,550 | $1,471,500 | $674,900 | $796,600 |
| 2016 | $9,104 | $1,302,500 | $566,300 | $736,200 |
| 2015 | $8,757 | $1,119,800 | $490,000 | $629,800 |
| 2014 | $8,746 | $1,043,700 | $422,600 | $621,100 |
Source: Public Records
Map
Nearby Homes
- 5 Centre St Unit 32
- 329 Harvard St Unit 1
- 11 Dana St Unit D
- 8 Chatham St Unit 4
- 950 Massachusetts Ave Unit 418
- 950 Massachusetts Ave Unit 512
- 950 Massachusetts Ave Unit 504
- 950 Massachusetts Ave Unit 417
- 39 Ellery St Unit 6
- 2 Ellery Square
- 55 Ellery St Unit 3
- 863 Massachusetts Ave Unit 25
- 60 Ellery St
- 515 Franklin St Unit 4
- 30 Bigelow St Unit B
- 280 Harvard St Unit 1A
- 33 Inman St Unit 1B
- 28 Inman St Unit 4
- 149A Bishop Allen Unit A
- 53 Jay St Unit 2
- 15 Centre St
- 15 Centre St Unit 15
- 15 Centre St Unit F
- 15 Centre St Unit 14-F
- 15 Centre St Unit 5
- 15 Centre St Unit 1
- 15 Centre St Unit 6
- 15 Centre St Unit 2
- 15 Centre St Unit i
- 17 Centre St Unit B
- 17 Centre St Unit I
- 17 Centre St Unit 5
- 17 Centre St
- 17 Centre St Unit 6
- 17 Centre St Unit 4
- 17 Centre St Unit 2
- 17 Centre St Unit F
- 17 Centre St Unit 3
- 17 Centre St Unit 1
- 17 Centre St