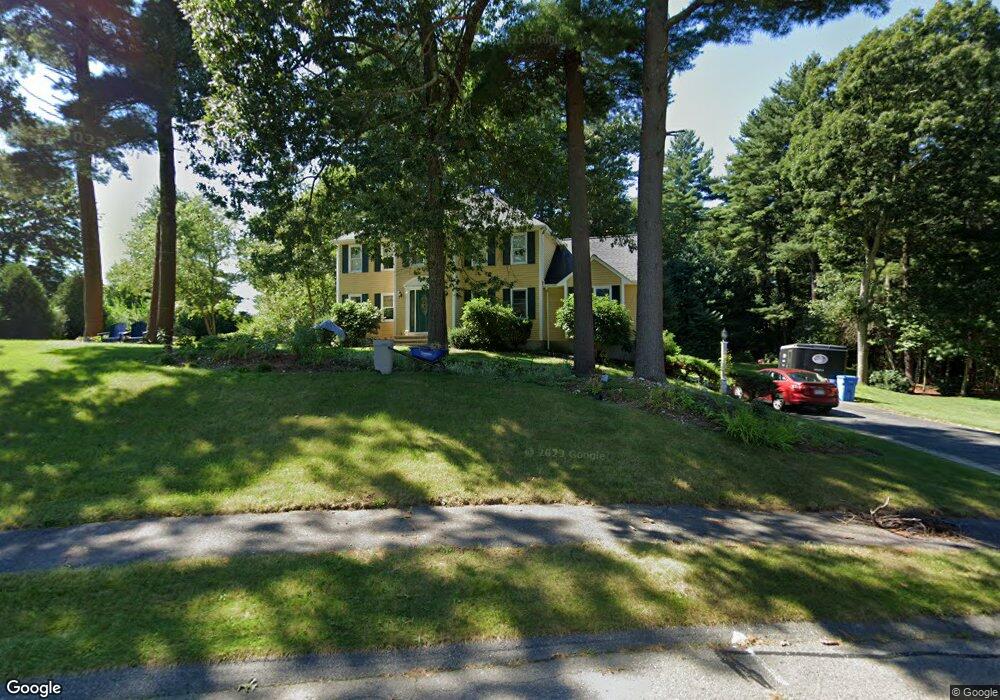
15 Charles Samuel Way Wrentham, MA 02093
Estimated Value: $848,052 - $997,000
4
Beds
3
Baths
2,334
Sq Ft
$405/Sq Ft
Est. Value
About This Home
This home is located at 15 Charles Samuel Way, Wrentham, MA 02093 and is currently estimated at $946,263, approximately $405 per square foot. 15 Charles Samuel Way is a home located in Norfolk County with nearby schools including Delaney Elementary School, Charles E Roderick, and Foxborough Regional Charter School.
Ownership History
Date
Name
Owned For
Owner Type
Purchase Details
Closed on
Dec 11, 1995
Sold by
Joel Constr Inc
Bought by
Plantamura Alan M and Plantamura Elizabeth P
Current Estimated Value
Home Financials for this Owner
Home Financials are based on the most recent Mortgage that was taken out on this home.
Original Mortgage
$185,000
Interest Rate
7.44%
Mortgage Type
Purchase Money Mortgage
Create a Home Valuation Report for This Property
The Home Valuation Report is an in-depth analysis detailing your home's value as well as a comparison with similar homes in the area
Home Values in the Area
Average Home Value in this Area
Purchase History
| Date | Buyer | Sale Price | Title Company |
|---|---|---|---|
| Plantamura Alan M | $254,900 | -- |
Source: Public Records
Mortgage History
| Date | Status | Borrower | Loan Amount |
|---|---|---|---|
| Open | Plantamura Alan M | $100,688 | |
| Closed | Plantamura Alan M | $185,000 |
Source: Public Records
Tax History Compared to Growth
Tax History
| Year | Tax Paid | Tax Assessment Tax Assessment Total Assessment is a certain percentage of the fair market value that is determined by local assessors to be the total taxable value of land and additions on the property. | Land | Improvement |
|---|---|---|---|---|
| 2025 | $8,573 | $739,700 | $303,800 | $435,900 |
| 2024 | $8,282 | $690,200 | $303,800 | $386,400 |
| 2023 | $7,961 | $630,800 | $276,200 | $354,600 |
| 2022 | $7,770 | $568,400 | $257,700 | $310,700 |
| 2021 | $7,191 | $511,100 | $225,100 | $286,000 |
| 2020 | $7,269 | $510,100 | $200,300 | $309,800 |
| 2019 | $7,004 | $496,000 | $200,300 | $295,700 |
| 2018 | $6,790 | $476,800 | $200,500 | $276,300 |
| 2017 | $6,655 | $467,000 | $196,700 | $270,300 |
| 2016 | $6,513 | $456,100 | $191,000 | $265,100 |
| 2015 | $6,540 | $436,600 | $183,600 | $253,000 |
| 2014 | $6,433 | $420,200 | $176,600 | $243,600 |
Source: Public Records
Map
Nearby Homes