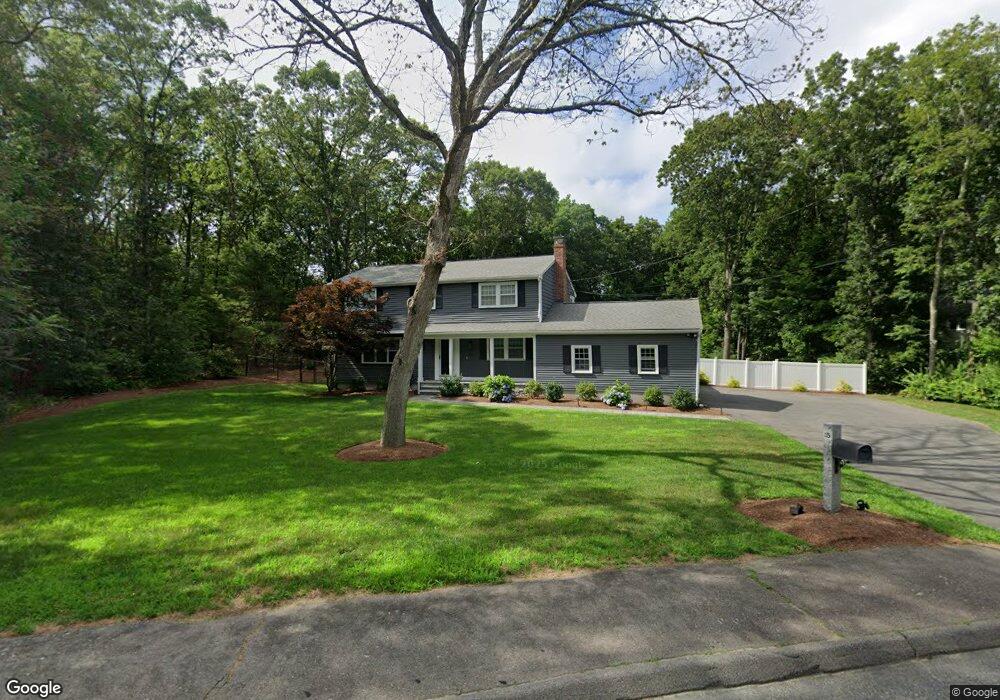
15 Chessman Dr Sharon, MA 02067
Estimated Value: $953,149 - $1,145,000
4
Beds
3
Baths
2,160
Sq Ft
$476/Sq Ft
Est. Value
About This Home
This home is located at 15 Chessman Dr, Sharon, MA 02067 and is currently estimated at $1,029,037, approximately $476 per square foot. 15 Chessman Dr is a home located in Norfolk County with nearby schools including East Elementary School, Sharon Middle School, and Sharon High School.
Ownership History
Date
Name
Owned For
Owner Type
Purchase Details
Closed on
Oct 21, 2005
Sold by
Foreman Beth R and Foreman Ronald E
Bought by
Hoffstein Philip A and Hoffstein Susan E
Current Estimated Value
Home Financials for this Owner
Home Financials are based on the most recent Mortgage that was taken out on this home.
Original Mortgage
$359,650
Interest Rate
5.72%
Mortgage Type
Purchase Money Mortgage
Purchase Details
Closed on
Dec 21, 1998
Sold by
Greiff Andrew S and Greiff Kim L
Bought by
Foreman Ronald E and Foreman Beth R
Purchase Details
Closed on
Jul 17, 1992
Sold by
Lapenson Jerry and Lapenson Rosalind H
Bought by
Greiff Andrew S and Greiff Kim L
Create a Home Valuation Report for This Property
The Home Valuation Report is an in-depth analysis detailing your home's value as well as a comparison with similar homes in the area
Home Values in the Area
Average Home Value in this Area
Purchase History
| Date | Buyer | Sale Price | Title Company |
|---|---|---|---|
| Hoffstein Philip A | $550,000 | -- | |
| Foreman Ronald E | $335,000 | -- | |
| Greiff Andrew S | $245,000 | -- |
Source: Public Records
Mortgage History
| Date | Status | Borrower | Loan Amount |
|---|---|---|---|
| Open | Greiff Andrew S | $360,000 | |
| Closed | Greiff Andrew S | $338,400 | |
| Closed | Hoffstein Philip A | $359,650 |
Source: Public Records
Tax History Compared to Growth
Tax History
| Year | Tax Paid | Tax Assessment Tax Assessment Total Assessment is a certain percentage of the fair market value that is determined by local assessors to be the total taxable value of land and additions on the property. | Land | Improvement |
|---|---|---|---|---|
| 2025 | $15,216 | $870,500 | $485,900 | $384,600 |
| 2024 | $14,542 | $827,200 | $445,800 | $381,400 |
| 2023 | $13,928 | $749,200 | $416,800 | $332,400 |
| 2022 | $13,126 | $664,600 | $347,300 | $317,300 |
| 2021 | $12,987 | $635,700 | $327,500 | $308,200 |
| 2020 | $12,078 | $635,700 | $327,500 | $308,200 |
| 2019 | $11,898 | $613,000 | $304,800 | $308,200 |
| 2018 | $11,761 | $607,200 | $299,000 | $308,200 |
| 2017 | $11,533 | $587,800 | $279,600 | $308,200 |
| 2016 | $11,276 | $560,700 | $279,600 | $281,100 |
| 2015 | $10,741 | $529,100 | $260,600 | $268,500 |
| 2014 | $9,944 | $483,900 | $237,000 | $246,900 |
Source: Public Records
Map
Nearby Homes