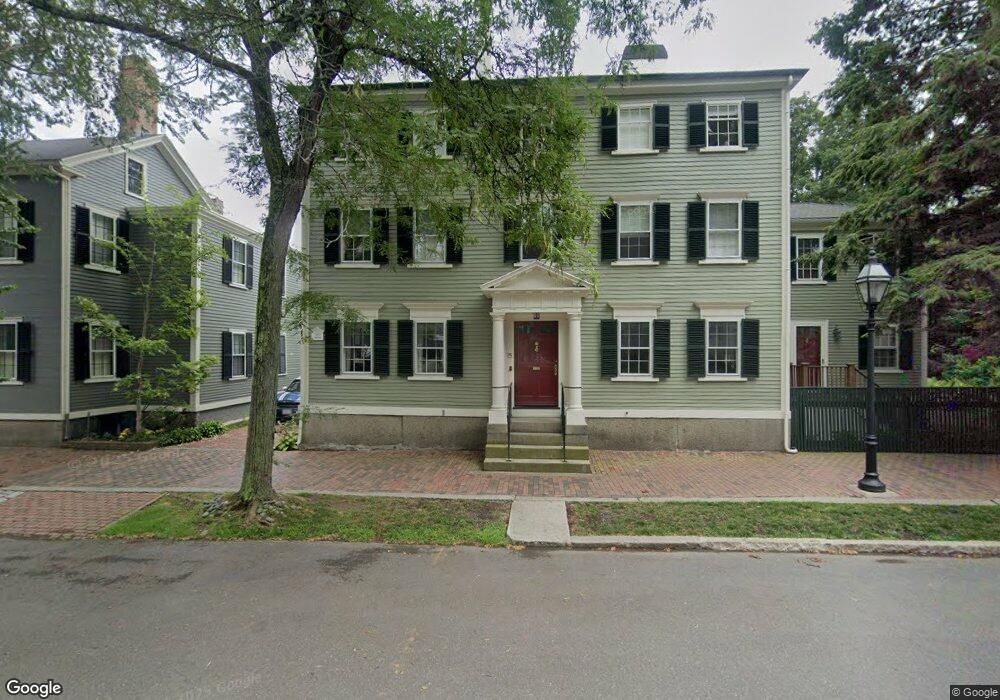
15 Chestnut St Salem, MA 01970
Downtown Salem NeighborhoodEstimated Value: $1,441,000 - $1,861,839
7
Beds
5
Baths
5,063
Sq Ft
$339/Sq Ft
Est. Value
About This Home
This home is located at 15 Chestnut St, Salem, MA 01970 and is currently estimated at $1,717,710, approximately $339 per square foot. 15 Chestnut St is a home located in Essex County with nearby schools including Saltonstall School, Carlton Elementary School, and Bates Elementary School.
Ownership History
Date
Name
Owned For
Owner Type
Purchase Details
Closed on
Jul 23, 2009
Sold by
Burns Jeremiah S and Burns Abby L
Bought by
Gordon Peter
Current Estimated Value
Home Financials for this Owner
Home Financials are based on the most recent Mortgage that was taken out on this home.
Original Mortgage
$584,000
Outstanding Balance
$386,351
Interest Rate
5.58%
Mortgage Type
Purchase Money Mortgage
Estimated Equity
$1,331,359
Create a Home Valuation Report for This Property
The Home Valuation Report is an in-depth analysis detailing your home's value as well as a comparison with similar homes in the area
Home Values in the Area
Average Home Value in this Area
Purchase History
| Date | Buyer | Sale Price | Title Company |
|---|---|---|---|
| Gordon Peter | $730,000 | -- |
Source: Public Records
Mortgage History
| Date | Status | Borrower | Loan Amount |
|---|---|---|---|
| Open | Gordon Peter | $584,000 | |
| Previous Owner | Gordon Peter | $150,000 | |
| Previous Owner | Gordon Peter | $177,000 |
Source: Public Records
Tax History
| Year | Tax Paid | Tax Assessment Tax Assessment Total Assessment is a certain percentage of the fair market value that is determined by local assessors to be the total taxable value of land and additions on the property. | Land | Improvement |
|---|---|---|---|---|
| 2025 | $18,559 | $1,636,600 | $297,300 | $1,339,300 |
| 2024 | $18,054 | $1,553,700 | $283,800 | $1,269,900 |
| 2023 | $17,167 | $1,372,300 | $256,800 | $1,115,500 |
| 2022 | $15,204 | $1,147,500 | $243,300 | $904,200 |
| 2021 | $15,583 | $1,129,200 | $243,300 | $885,900 |
| 2020 | $16,026 | $1,109,100 | $236,500 | $872,600 |
| 2019 | $15,417 | $1,021,000 | $227,100 | $793,900 |
| 2018 | $13,993 | $909,800 | $216,300 | $693,500 |
| 2017 | $13,471 | $849,400 | $202,700 | $646,700 |
| 2016 | $13,152 | $839,300 | $192,600 | $646,700 |
| 2015 | $14,050 | $856,200 | $192,600 | $663,600 |
Source: Public Records
Map
Nearby Homes
- 11 Summer St
- 22 Prescott St Unit 1
- 289 Essex St Unit 211
- 289 Essex St Unit 308
- 24 Norman St Unit 110
- 17 North St Unit 2
- 15 Phelps St Unit 1
- 35 Flint St Unit 209
- 35 Flint St Unit 106
- 16 River St
- 23 River St
- 18 Dalton Pkwy Unit 18
- 65 Washington St Unit 512
- 11 Church St Unit 203
- 11 Church St Unit 702
- 11 Church St Unit 703
- 3 S Mason St
- 86 Flint St
- 7 Fairfield St
- 185 Lafayette St Unit 3
- 17 Chestnut St Unit 2
- 17 Chestnut St Unit 1
- 14 Cambridge St
- 14 Cambridge St Unit 1
- 16 Cambridge St
- 14 Broad St
- 18 Cambridge St
- 19 Chestnut St
- 23 Chestnut St
- 9 Cambridge St
- 13 Cambridge St
- 11 Cambridge St
- 15 Cambridge St Unit 2
- 15 Cambridge St
- 15 Cambridge St Unit 1
- 12 Broad St
- 14 Chestnut St
- 18 Chestnut St
- 12 Chestnut St
- 17 Cambridge St
Your Personal Tour Guide
Ask me questions while you tour the home.