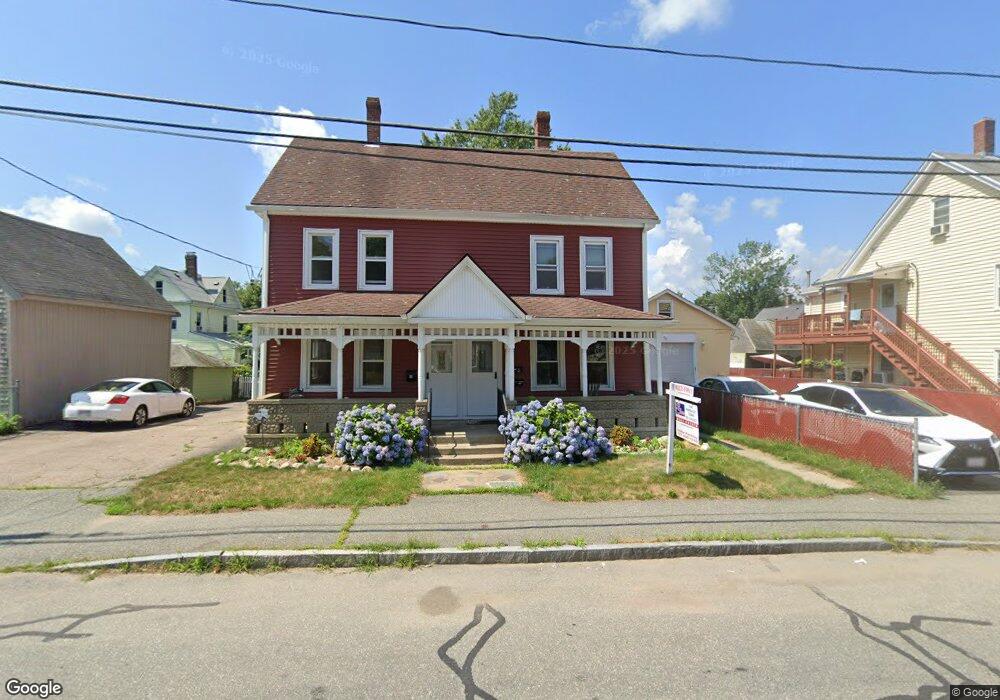
15 Chestnut St Stoughton, MA 02072
Estimated Value: $725,000 - $858,000
6
Beds
3
Baths
2,314
Sq Ft
$356/Sq Ft
Est. Value
About This Home
This home is located at 15 Chestnut St, Stoughton, MA 02072 and is currently estimated at $822,660, approximately $355 per square foot. 15 Chestnut St is a home located in Norfolk County with nearby schools including Joseph R Dawe Jr Elementary School, O'Donnell Middle School, and Stoughton High School.
Ownership History
Date
Name
Owned For
Owner Type
Purchase Details
Closed on
Jul 15, 2025
Sold by
Chestnut 15 Nt and Malinowski
Bought by
Jeanty Yvrose
Current Estimated Value
Home Financials for this Owner
Home Financials are based on the most recent Mortgage that was taken out on this home.
Original Mortgage
$783,250
Outstanding Balance
$781,924
Interest Rate
6.85%
Mortgage Type
New Conventional
Estimated Equity
$40,736
Purchase Details
Closed on
May 9, 2018
Sold by
17 Chestnut Street Rt and Baldassini
Bought by
Chestnut 15 Nt and Malinowski
Home Financials for this Owner
Home Financials are based on the most recent Mortgage that was taken out on this home.
Original Mortgage
$200,000
Interest Rate
4.44%
Mortgage Type
New Conventional
Purchase Details
Closed on
Aug 22, 2008
Sold by
Ruggiero Dorothy C and Ruggiero John P
Bought by
Ruggiero Dennis B and Ruggiero Dorothy C
Home Financials for this Owner
Home Financials are based on the most recent Mortgage that was taken out on this home.
Original Mortgage
$50,000
Interest Rate
6.4%
Mortgage Type
Purchase Money Mortgage
Create a Home Valuation Report for This Property
The Home Valuation Report is an in-depth analysis detailing your home's value as well as a comparison with similar homes in the area
Home Values in the Area
Average Home Value in this Area
Purchase History
| Date | Buyer | Sale Price | Title Company |
|---|---|---|---|
| Jeanty Yvrose | $851,000 | -- | |
| Jeanty Yvrose | $851,000 | -- | |
| Chestnut 15 Nt | $320,000 | -- | |
| Chestnut 15 Nt | $320,000 | -- | |
| Chestnut 15 Nt | $320,000 | -- | |
| Ruggiero Dennis B | -- | -- | |
| 17 Chestnut Street Rt | -- | -- | |
| Ruggiero Dennis B | -- | -- |
Source: Public Records
Mortgage History
| Date | Status | Borrower | Loan Amount |
|---|---|---|---|
| Open | Jeanty Yvrose | $783,250 | |
| Closed | Jeanty Yvrose | $783,250 | |
| Previous Owner | Chestnut 15 Nt | $200,000 | |
| Previous Owner | Ruggiero Dennis B | $50,000 |
Source: Public Records
Tax History Compared to Growth
Tax History
| Year | Tax Paid | Tax Assessment Tax Assessment Total Assessment is a certain percentage of the fair market value that is determined by local assessors to be the total taxable value of land and additions on the property. | Land | Improvement |
|---|---|---|---|---|
| 2025 | $6,834 | $552,000 | $201,800 | $350,200 |
| 2024 | $6,662 | $523,300 | $183,900 | $339,400 |
| 2023 | $6,917 | $510,500 | $170,900 | $339,600 |
| 2022 | $6,250 | $433,700 | $156,300 | $277,400 |
| 2021 | $5,992 | $396,800 | $141,600 | $255,200 |
| 2020 | $5,506 | $369,800 | $136,700 | $233,100 |
| 2019 | $5,489 | $357,800 | $136,700 | $221,100 |
| 2018 | $5,203 | $351,300 | $130,200 | $221,100 |
| 2017 | $4,940 | $340,900 | $123,700 | $217,200 |
| 2016 | $4,388 | $293,100 | $113,900 | $179,200 |
| 2015 | $4,336 | $286,600 | $107,400 | $179,200 |
| 2014 | $4,033 | $256,200 | $97,700 | $158,500 |
Source: Public Records
Map
Nearby Homes
- 6 Grove St
- 58 Union St Unit 15
- 11 Monk St
- 15 Jones Terrace Unit 2
- 17 Jones Terrace Unit 4
- 310 Lincoln St
- 5-9 Morton Square
- 15-17 Morton Square
- 18 Britton St
- 36 Pleasant Dr Unit 42
- 62 Kinsley St
- 68 Crescent Ave
- 79 Kinsley St
- 26 Faxon St Unit 2
- 39 Talbot St
- 73 Crescent Ave
- 702 Central St
- 959 Washington St
- 59 Summer Ave
- 52 Adams St
- 7 Chestnut St
- 142 Seaver St
- 148 Seaver St
- 137 Pleasant St
- 131 Pleasant St
- 138 Seaver St
- 145 Pleasant St
- 20/22 Chestnut St
- 22 Chestnut St Unit 2
- 22 Chestnut St
- 158 Seaver St
- 123 Pleasant St
- 155 Pleasant St
- 20 Chestnut St
- 20 Chestnut St Unit 1
- 12 Chestnut St
- 147 Seaver St
- 147 Seaver St Unit 1
- 147 Seaver St Unit 2
- 122 Seaver St