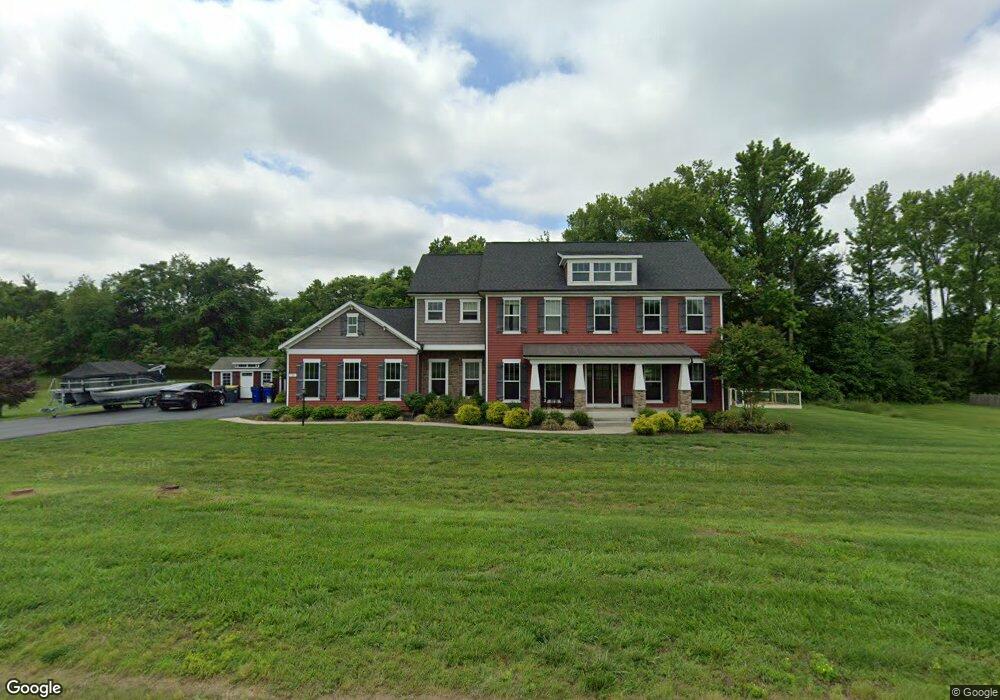
15 Chet Atkins Ct Fredericksburg, VA 22405
Highland Home NeighborhoodEstimated Value: $726,000 - $930,000
4
Beds
5
Baths
3,696
Sq Ft
$231/Sq Ft
Est. Value
About This Home
This home is located at 15 Chet Atkins Ct, Fredericksburg, VA 22405 and is currently estimated at $854,356, approximately $231 per square foot. 15 Chet Atkins Ct is a home located in Stafford County with nearby schools including Grafton Village Elementary School, Donald B. Dixon-Lyle R. Smith Middle School, and Stafford Senior High School.
Ownership History
Date
Name
Owned For
Owner Type
Purchase Details
Closed on
Mar 10, 2020
Sold by
Griego Scott Jeremy and Griego Crystal Ann
Bought by
Griego Scott Jeremy and Griego Crystal Ann
Current Estimated Value
Purchase Details
Closed on
Dec 20, 2018
Sold by
Aaronal Homes Inc
Bought by
Griego Scott Jeremy and Smith-Griego Crystal A
Home Financials for this Owner
Home Financials are based on the most recent Mortgage that was taken out on this home.
Original Mortgage
$696,249
Outstanding Balance
$614,635
Interest Rate
4.9%
Mortgage Type
VA
Estimated Equity
$239,722
Purchase Details
Closed on
Apr 30, 2018
Sold by
Janney Paul D
Bought by
Aaronal Homes Inc A Virignia Corporation
Home Financials for this Owner
Home Financials are based on the most recent Mortgage that was taken out on this home.
Original Mortgage
$426,206
Interest Rate
4.44%
Mortgage Type
Commercial
Create a Home Valuation Report for This Property
The Home Valuation Report is an in-depth analysis detailing your home's value as well as a comparison with similar homes in the area
Home Values in the Area
Average Home Value in this Area
Purchase History
| Date | Buyer | Sale Price | Title Company |
|---|---|---|---|
| Griego Scott Jeremy | -- | None Available | |
| Griego Scott Jeremy | $682,245 | Attorney | |
| Aaronal Homes Inc A Virignia Corporation | $125,000 | Attorney |
Source: Public Records
Mortgage History
| Date | Status | Borrower | Loan Amount |
|---|---|---|---|
| Open | Griego Scott Jeremy | $696,249 | |
| Previous Owner | Aaronal Homes Inc A Virignia Corporation | $426,206 |
Source: Public Records
Tax History Compared to Growth
Tax History
| Year | Tax Paid | Tax Assessment Tax Assessment Total Assessment is a certain percentage of the fair market value that is determined by local assessors to be the total taxable value of land and additions on the property. | Land | Improvement |
|---|---|---|---|---|
| 2025 | $6,608 | $728,800 | $160,000 | $568,800 |
| 2024 | $6,608 | $728,800 | $160,000 | $568,800 |
| 2023 | $6,415 | $678,800 | $125,000 | $553,800 |
| 2022 | $5,770 | $678,800 | $125,000 | $553,800 |
| 2021 | $5,806 | $598,600 | $100,000 | $498,600 |
| 2020 | $5,806 | $598,600 | $100,000 | $498,600 |
| 2019 | $6,172 | $611,100 | $100,000 | $511,100 |
| 2018 | $990 | $100,000 | $100,000 | $0 |
| 2017 | $743 | $75,000 | $75,000 | $0 |
| 2016 | $743 | $75,000 | $75,000 | $0 |
| 2015 | -- | $75,000 | $75,000 | $0 |
| 2014 | -- | $75,000 | $75,000 | $0 |
Source: Public Records
Map
Nearby Homes
- 18 Ironwood Rd
- 25 Sunset Ridge Ln
- 2 Sunset Ridge Ln
- 10 Cross Cut Ln
- 16 Little Field Dr
- 14 Indian Wood Ln
- 55 Hamstead Rd
- 50 Hamstead Rd
- Preston Plan at White Oak Reserve
- Presley Plan at White Oak Reserve
- Hemingway Plan at White Oak Reserve
- 201 Camwood Ct
- 173 Little Whim Rd
- 205 Camwood Ct
- 209 Camwood Ct
- 2123 Matthew Ln
- 176 Little Whim Rd
- 213 Camwood Ct
- 217 Camwood Ct
- 33 Summerfield Ln
- 0 Chet Atkins Ct Unit 1007652470
- 0 Chet Atkins Ct Unit ST9749655
- 0 Chet Atkins Ct Unit 1000094993
- 19 Chet Atkins Ct
- 18 Chet Atkins Ct
- 11 Chet Atkins Ct
- 32 Henry Sealar Ln
- 32 Chet Atkins Ct
- 40 Chet Atkins Ct
- 45 Chet Atkins Ct
- 12 Chet Atkins Ct
- 12 Chet Adkins Ct
- 12 Chet Atkins Ct
- 35 Boscobel Rd
- 164 Brooke Rd
- 25 Henry Sealar Ln
- 15 Boscobel Rd
- 41 Boscobel Rd
- 162 Brooke Rd
- 55 Boscobel Rd