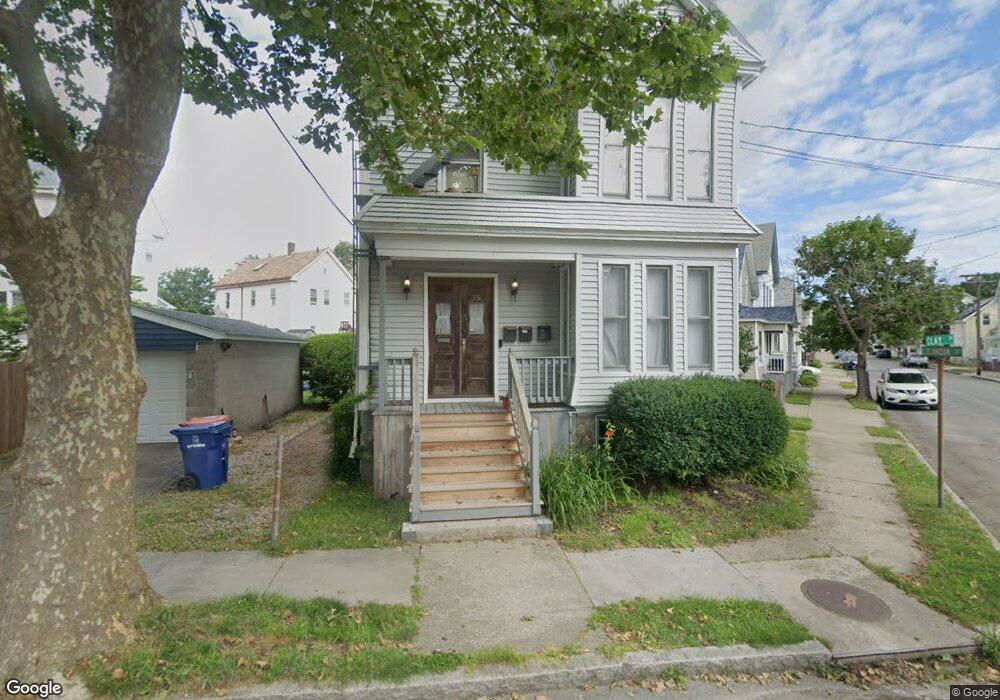
15 Clay St New Bedford, MA 02740
The South End NeighborhoodEstimated Value: $501,000 - $545,585
5
Beds
3
Baths
2,263
Sq Ft
$231/Sq Ft
Est. Value
About This Home
This home is located at 15 Clay St, New Bedford, MA 02740 and is currently estimated at $523,146, approximately $231 per square foot. 15 Clay St is a home located in Bristol County with nearby schools including James B. Congdon Elementary, Roosevelt Middle School, and New Bedford High School.
Ownership History
Date
Name
Owned For
Owner Type
Purchase Details
Closed on
Dec 7, 2005
Sold by
Tracy Ryan W
Bought by
Tracy Jacqueline
Current Estimated Value
Home Financials for this Owner
Home Financials are based on the most recent Mortgage that was taken out on this home.
Original Mortgage
$240,000
Outstanding Balance
$133,323
Interest Rate
6.17%
Mortgage Type
Purchase Money Mortgage
Estimated Equity
$389,823
Purchase Details
Closed on
Feb 2, 2004
Sold by
Iacaponi Mark E
Bought by
Tracy Jacqueline and Silva Kim Ann
Purchase Details
Closed on
Jul 2, 1997
Sold by
Sweet Donald E
Bought by
Iacaponi Mark and Pavao Dennis
Create a Home Valuation Report for This Property
The Home Valuation Report is an in-depth analysis detailing your home's value as well as a comparison with similar homes in the area
Home Values in the Area
Average Home Value in this Area
Purchase History
| Date | Buyer | Sale Price | Title Company |
|---|---|---|---|
| Tracy Jacqueline | $300,000 | -- | |
| Tracy Jacqueline | $300,000 | -- | |
| Tracy Jacqueline | $265,000 | -- | |
| Tracy Jacqueline | $265,000 | -- | |
| Iacaponi Mark | $84,000 | -- | |
| Iacaponi Mark | $84,000 | -- |
Source: Public Records
Mortgage History
| Date | Status | Borrower | Loan Amount |
|---|---|---|---|
| Open | Iacaponi Mark | $240,000 | |
| Closed | Iacaponi Mark | $240,000 | |
| Previous Owner | Iacaponi Mark | $236,000 |
Source: Public Records
Tax History Compared to Growth
Tax History
| Year | Tax Paid | Tax Assessment Tax Assessment Total Assessment is a certain percentage of the fair market value that is determined by local assessors to be the total taxable value of land and additions on the property. | Land | Improvement |
|---|---|---|---|---|
| 2025 | $5,429 | $480,000 | $86,400 | $393,600 |
| 2024 | $4,818 | $401,500 | $83,400 | $318,100 |
| 2023 | $4,559 | $319,000 | $69,800 | $249,200 |
| 2022 | $4,113 | $264,700 | $67,900 | $196,800 |
| 2021 | $2,447 | $255,000 | $64,800 | $190,200 |
| 2020 | $0 | $241,400 | $64,800 | $176,600 |
| 2019 | $3,399 | $206,400 | $64,800 | $141,600 |
| 2018 | $7,888 | $192,000 | $64,800 | $127,200 |
| 2017 | $2,952 | $176,900 | $66,400 | $110,500 |
| 2016 | $2,843 | $172,400 | $66,400 | $106,000 |
| 2015 | $2,658 | $169,000 | $66,400 | $102,600 |
| 2014 | $2,562 | $169,000 | $66,400 | $102,600 |
Source: Public Records
Map
Nearby Homes