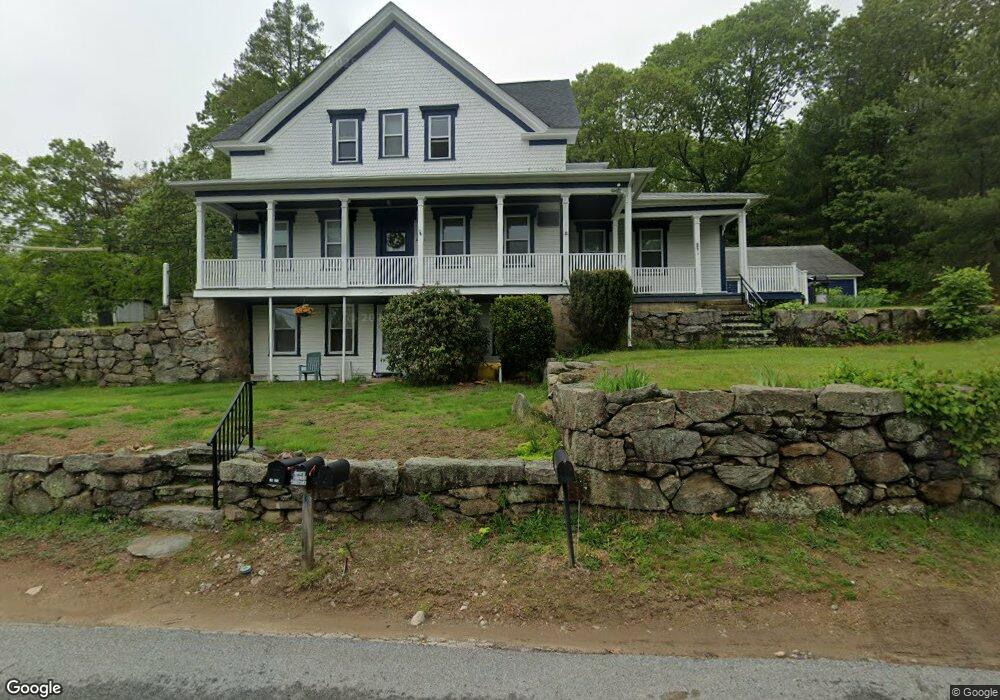
15 Congdon St Coventry, RI 02816
Estimated Value: $483,000 - $733,453
5
Beds
3
Baths
2,212
Sq Ft
$272/Sq Ft
Est. Value
About This Home
This home is located at 15 Congdon St, Coventry, RI 02816 and is currently estimated at $602,113, approximately $272 per square foot. 15 Congdon St is a home located in Kent County with nearby schools including Alan Shawn Feinstein Ms Of Cov, Coventry High School, and Father John V. Doyle School.
Ownership History
Date
Name
Owned For
Owner Type
Purchase Details
Closed on
Apr 30, 1991
Sold by
Arlia Russell
Bought by
Ray Anthony
Current Estimated Value
Home Financials for this Owner
Home Financials are based on the most recent Mortgage that was taken out on this home.
Original Mortgage
$162,348
Interest Rate
9.41%
Create a Home Valuation Report for This Property
The Home Valuation Report is an in-depth analysis detailing your home's value as well as a comparison with similar homes in the area
Purchase History
| Date | Buyer | Sale Price | Title Company |
|---|---|---|---|
| Ray Anthony | $171,000 | -- |
Source: Public Records
Mortgage History
| Date | Status | Borrower | Loan Amount |
|---|---|---|---|
| Open | Ray Anthony | $25,000 | |
| Open | Ray Anthony | $112,000 | |
| Closed | Ray Anthony | $162,348 |
Source: Public Records
Tax History
| Year | Tax Paid | Tax Assessment Tax Assessment Total Assessment is a certain percentage of the fair market value that is determined by local assessors to be the total taxable value of land and additions on the property. | Land | Improvement |
|---|---|---|---|---|
| 2025 | $5,512 | $342,600 | $123,100 | $219,500 |
| 2024 | $5,427 | $342,600 | $123,100 | $219,500 |
| 2023 | $5,252 | $342,600 | $123,100 | $219,500 |
| 2022 | $5,673 | $289,900 | $117,800 | $172,100 |
| 2021 | $5,624 | $289,900 | $117,800 | $172,100 |
| 2020 | $6,447 | $289,900 | $117,800 | $172,100 |
| 2019 | $4,944 | $222,300 | $97,500 | $124,800 |
| 2018 | $4,804 | $222,300 | $97,500 | $124,800 |
| 2017 | $4,664 | $222,300 | $97,500 | $124,800 |
| 2016 | $5,192 | $242,500 | $92,000 | $150,500 |
| 2015 | $5,051 | $242,500 | $92,000 | $150,500 |
| 2014 | $4,946 | $242,500 | $92,000 | $150,500 |
| 2013 | $5,109 | $273,800 | $103,900 | $169,900 |
Source: Public Records
Map
Nearby Homes
Your Personal Tour Guide
Ask me questions while you tour the home.